

 Stock Markets are Like a Coiled Spring
U.S. stock markets had another key reversal day today. A key reversal day is
a one-day pattern of trading that may signal the reversal of a trend. In a
downtrend, it happens when stock prices drop to a new low during the day but
close near the previous day’s highs.
Today, the S&P 500 fell 2.4% from Wednesday’s close as the latest U.S.
inflation statistics were higher than expected. However, as I have stated many
times, it does not matter how good or how bad the news is. All that really matters
is how much of the good or bad news is already factored into current prices.
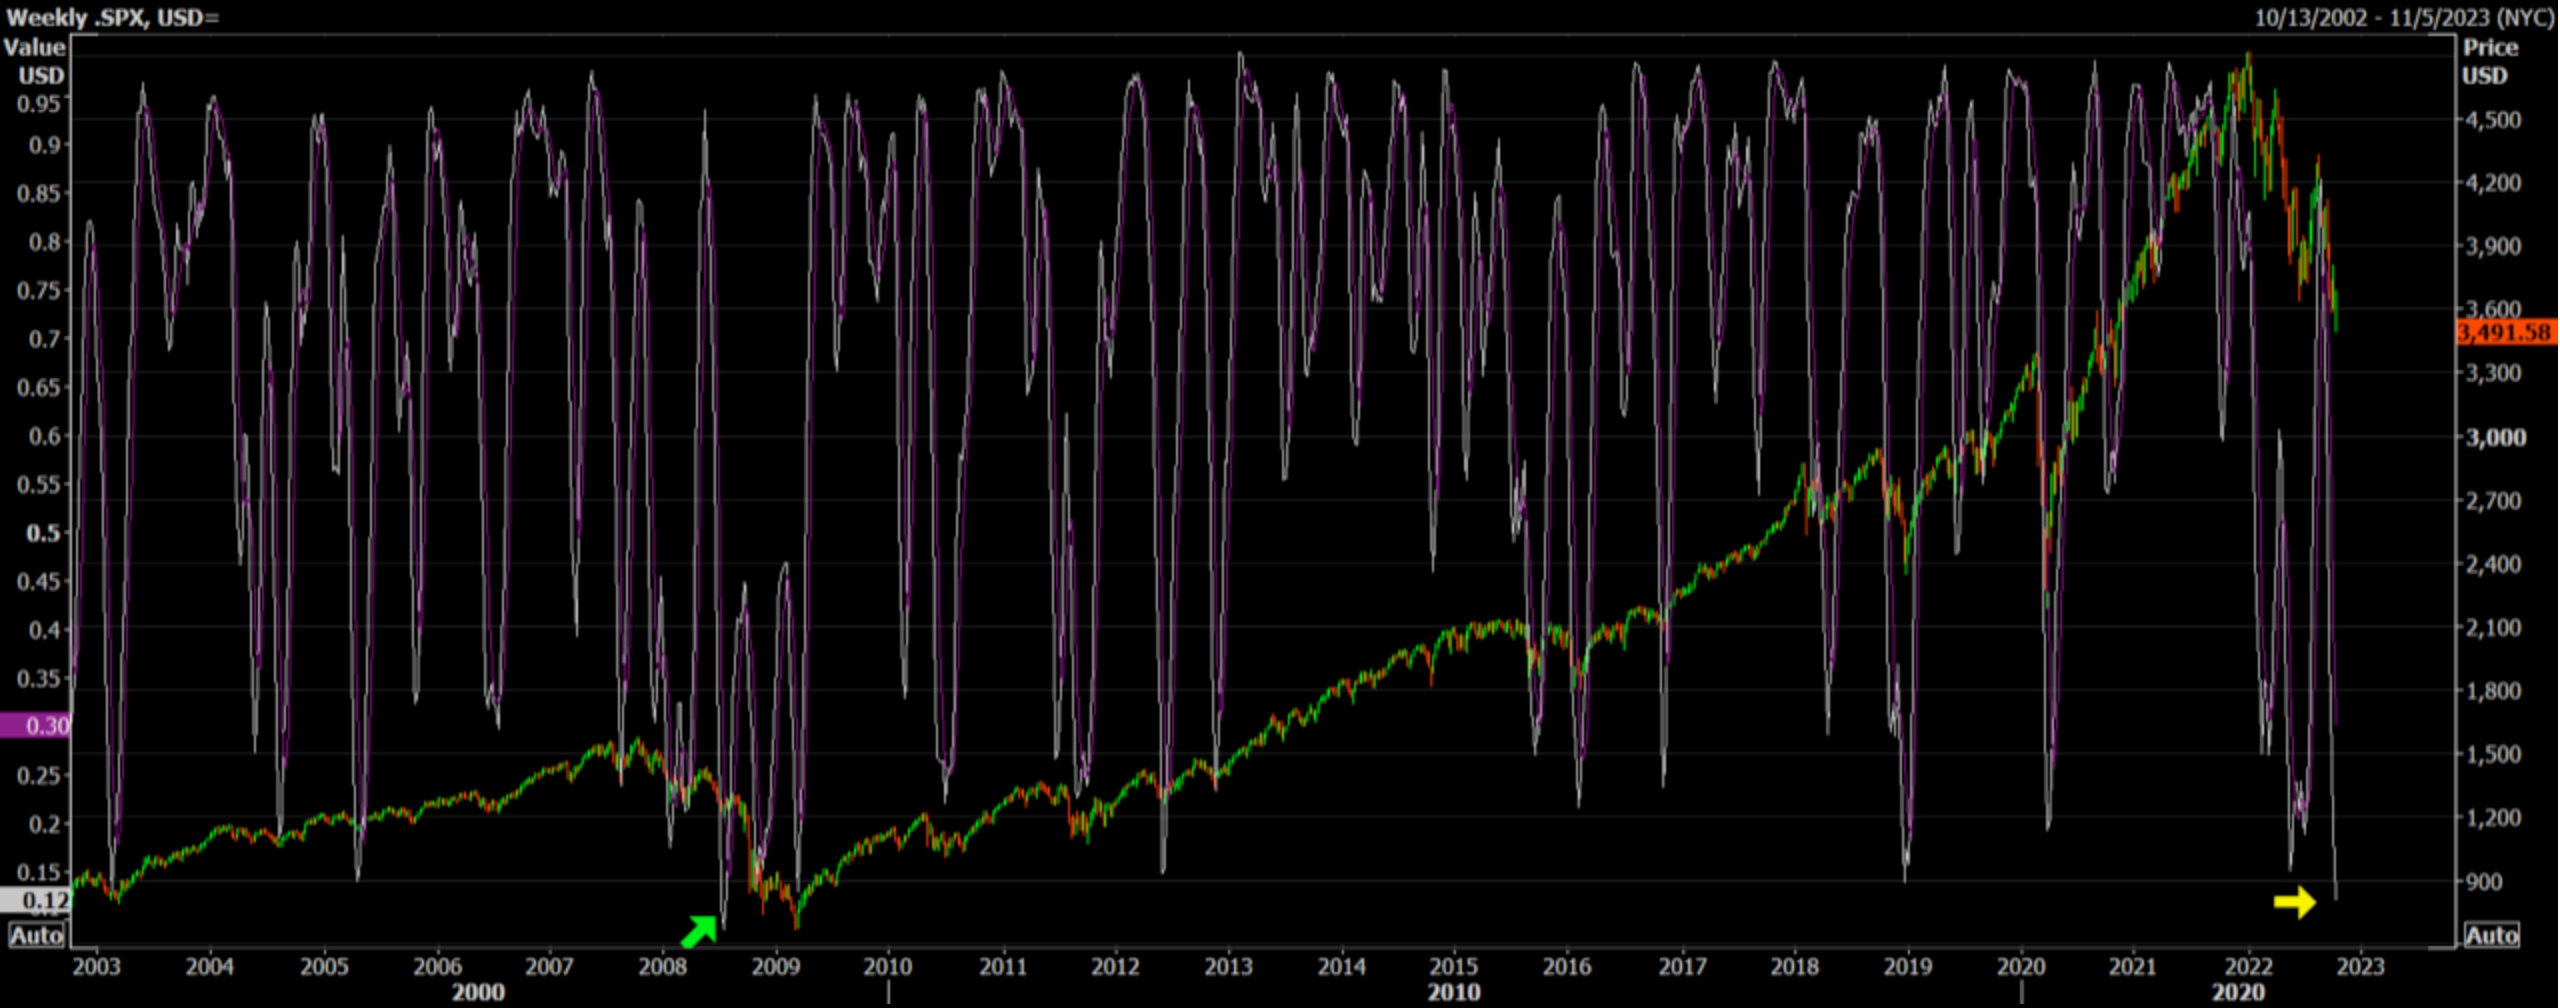
This chart appears to be very busy but just focus on two things please. This is a
long-term oscillator for the S&P 500 Index going back 20 years. When the white
line drops down to very low levels, it suggests that the worst-case scenario has
been factored into current prices. This oscillator has dropped to very low levels
many times and the S&P 500 has turned up for at least a short-time almost every
time. The yellow arrow on the bottom right shows that the oscillator has only been
this low one other time in the last 20 years. That was during the Financial Crisis in
2008. (See the green arrow.) This indicates that stocks are ripe for a bounce and
perhaps even a major reversal since stocks are so oversold.
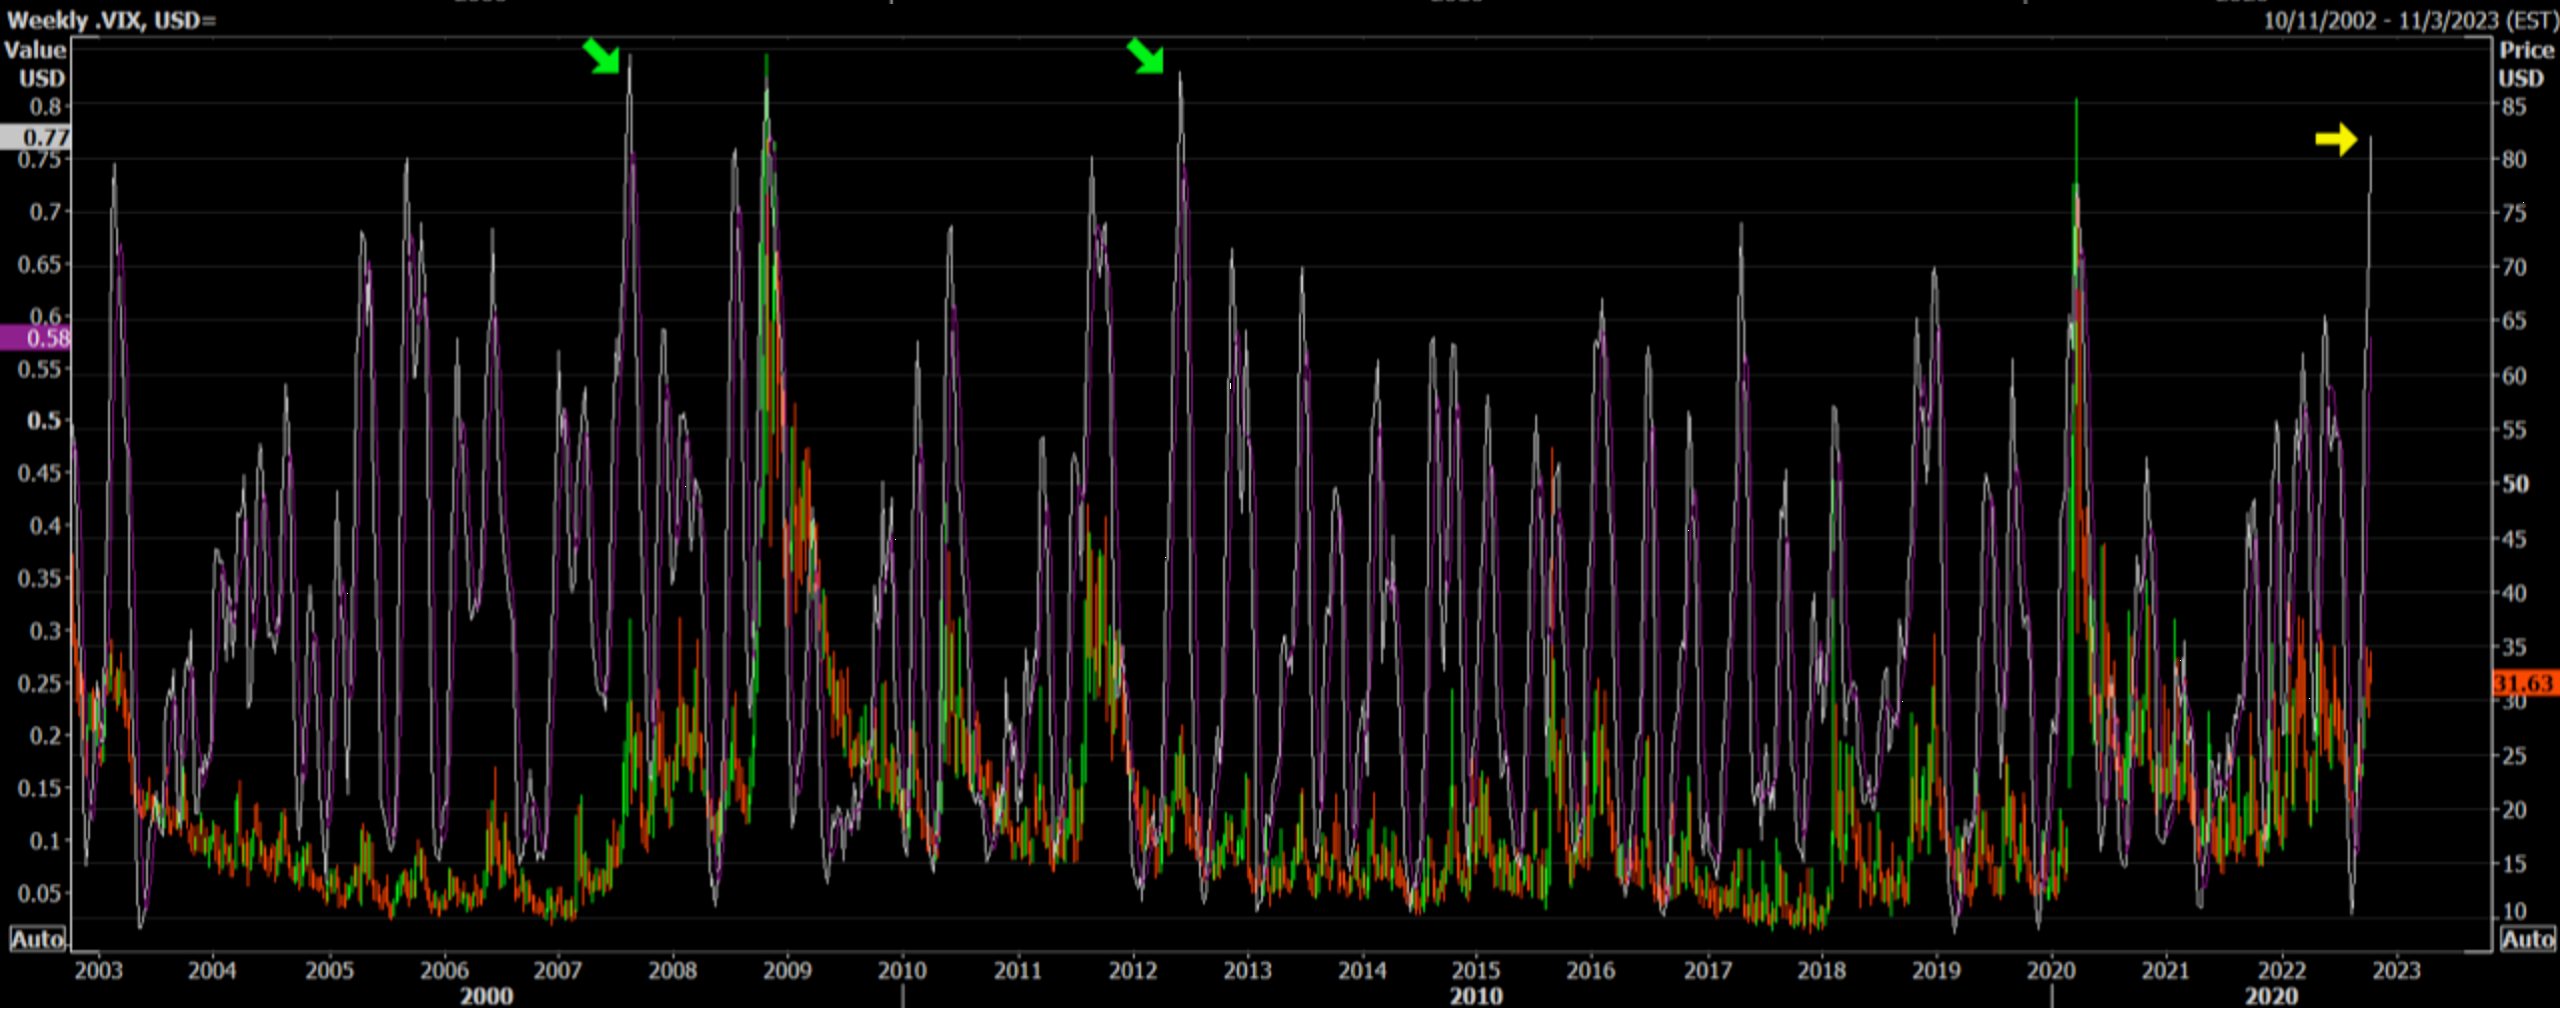
Volatility usually peaks when stock prices bottom. Today was the most
volatile day since March 2020. The oscillator for the U.S. Volatility Index (VIX)
has only been this high two other times in the last 20 years. The green arrow on
the top left shows when the VIX oscillator peaked during the 2008-2009
Financial Crisis. The S&P 500 rose from March 2009 to mid-2011.
The green arrow to the right of that shows when the oscillator for the VIX
peaked in June 2012. That is when the Greek Debt Crisis spooked investors,
causing the S&P 500 to drop by 10%. The S&P 500 started a six-year uptrend in
June 2012, which was punctuated by a 16% correction in early 2016 after oil
prices collapsed. Today, the oscillator for the VIX is once again at those
extremely high levels.
Pessimism is also at extremes seen near market bottoms. Many other
indicators that measure selling pressure are overextended to the point where it
seems like they cannot get any worse. This is when conditions are so bad that
they are good. This is when stock markets are like a spring that has been
compressed so far that it cannot go down anymore. The only way the spring can
move is to bounce higher in a violent fashion. This is why the title and subject of
last week’s Update was, “A Surprise Can Happen At Any Moment.”
When news of higher than expected U.S. inflation data was released this
morning, many traders sold stocks short, thinking that they could make money as
stocks went down. However, when stock prices fell 2%, buying came in causing
stock prices to rebound sharply. For example, the DJIA closed at 29,211 on
Wednesday. This morning, it fell 550 points at the open to a new 2022 low of
28,661. The rebound started soon after the start of trading and by the end of the
day the DJIA closed up 828 points or 2.83% at 30,039, just above the 30,000
level. The DJIA recovered all of the losses sustained in the last week, not just the
previous day. Today was the biggest one-day point swing for the DJIA in history.
Please see the five-day chart of the DJIA below. (From WSJ)

Major U.S. stock market averages are now just above the lows made in mid-June.
See the year-to-date chart below.

Human behaviour in stock markets often produces a pattern of a double bottom
anywhere from one to three months or so apart. Markets are trying very hard to
hold at the levels of the June lows. As said last week, stocks usually bottom on a
Tuesday. The second most likely day is a Thursday. Today was Thursday.
September is the worst month of the year with an average loss of just less than
1%. U.S. stock market averages were down more than 10% last month. If stocks
are already in a downtrend in September, they often fall into October and turn to
the upside between October 8th and October 20th. Today is October 13th.
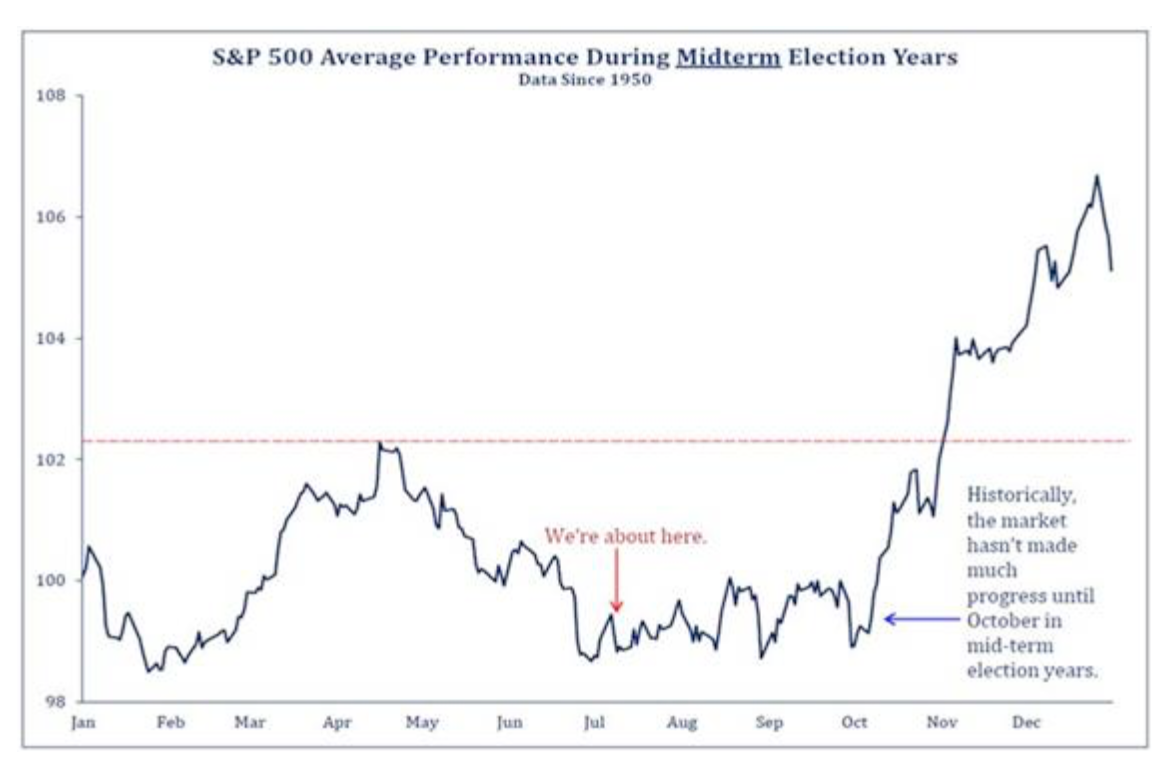
U.S. stocks are usually flat in a mid-term election year and then start a rising
trend in early October, as you can see in the chart below from Barometer.
What happened in the stock markets today made no sense if you were listening
to news about inflation or the war in the Ukraine. However, it was completely
logical and rational if you were paying attention to how oversold stock prices
were. The previous pages show that so many market-based factors were coming
together this month to force stock prices higher after a brutal bear market. Time
will tell if we have witnessed a significant turning point today. On the other hand,
it could take a little more time to complete this double bottoming process.
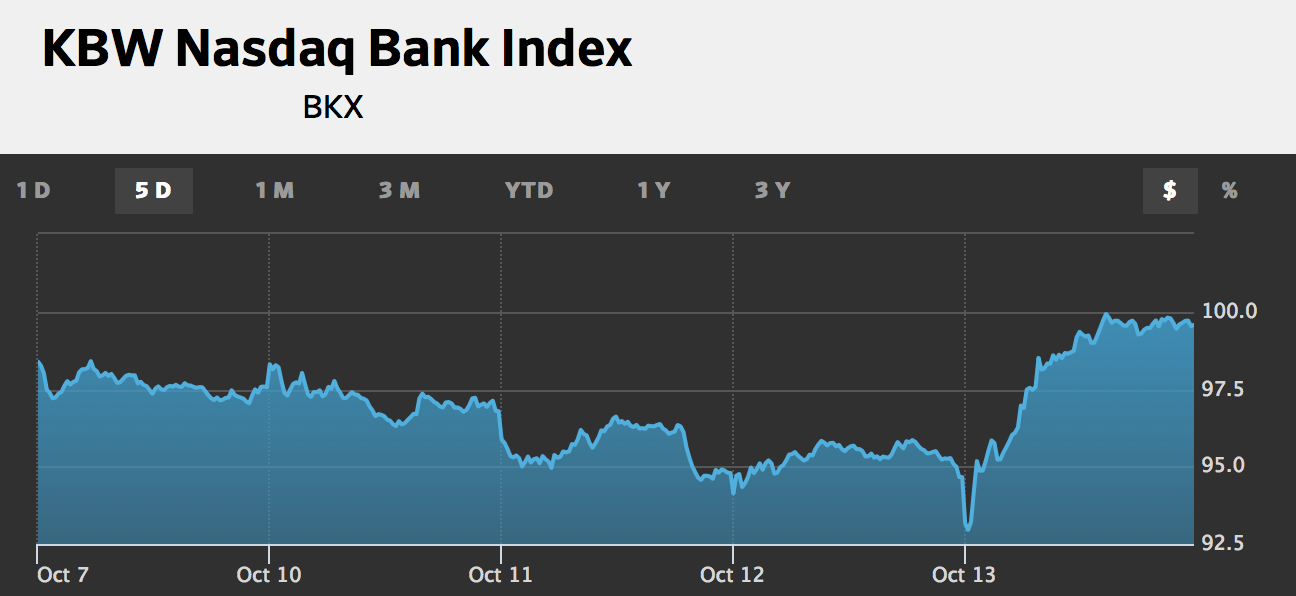
Banks are to the economy what gas stations are to the transportation system.
Banks supply the “fuel” for individuals and businesses. U.S. financial institutions
also make up a significant portion of major market averages except for the
NASDAQ. The NASDAQ Bank Index (symbol BKX) represents the share price
of many of the largest financial institutions in the United States. Financial shares
have a powerful influence over stock prices as a whole. BKX fell 2% in the start
of trading this morning but closed 5.19% higher on the day! That is a huge
reversal for this sector. I watch BKX on days like this. I noticed BKX was
already up 3% this morning when the S&P 500 and DJIA were still down for the
day. The shares of financial companies led the markets out of their slump today,
just like they led stock markets around the world higher on March 9, 2009. The
severe bear market during the 2008-2009 Financial Crisis ended on March 9,
2009.
In summary, U.S. stock markets produced a very positive surprise today. It
was unexpected for many, especially for those who thought they were smart and
sold, thinking that they could make money if the inflation news was bad. It was
not a surprise for any who read my Update last week. This is just another
example of why it is better to focus on how human behaviour is manifesting itself
in the markets than to dwell on current events.
Even though today was a major key reversal day, it will take at least a week or
two to have confirmation that this bear market is over.
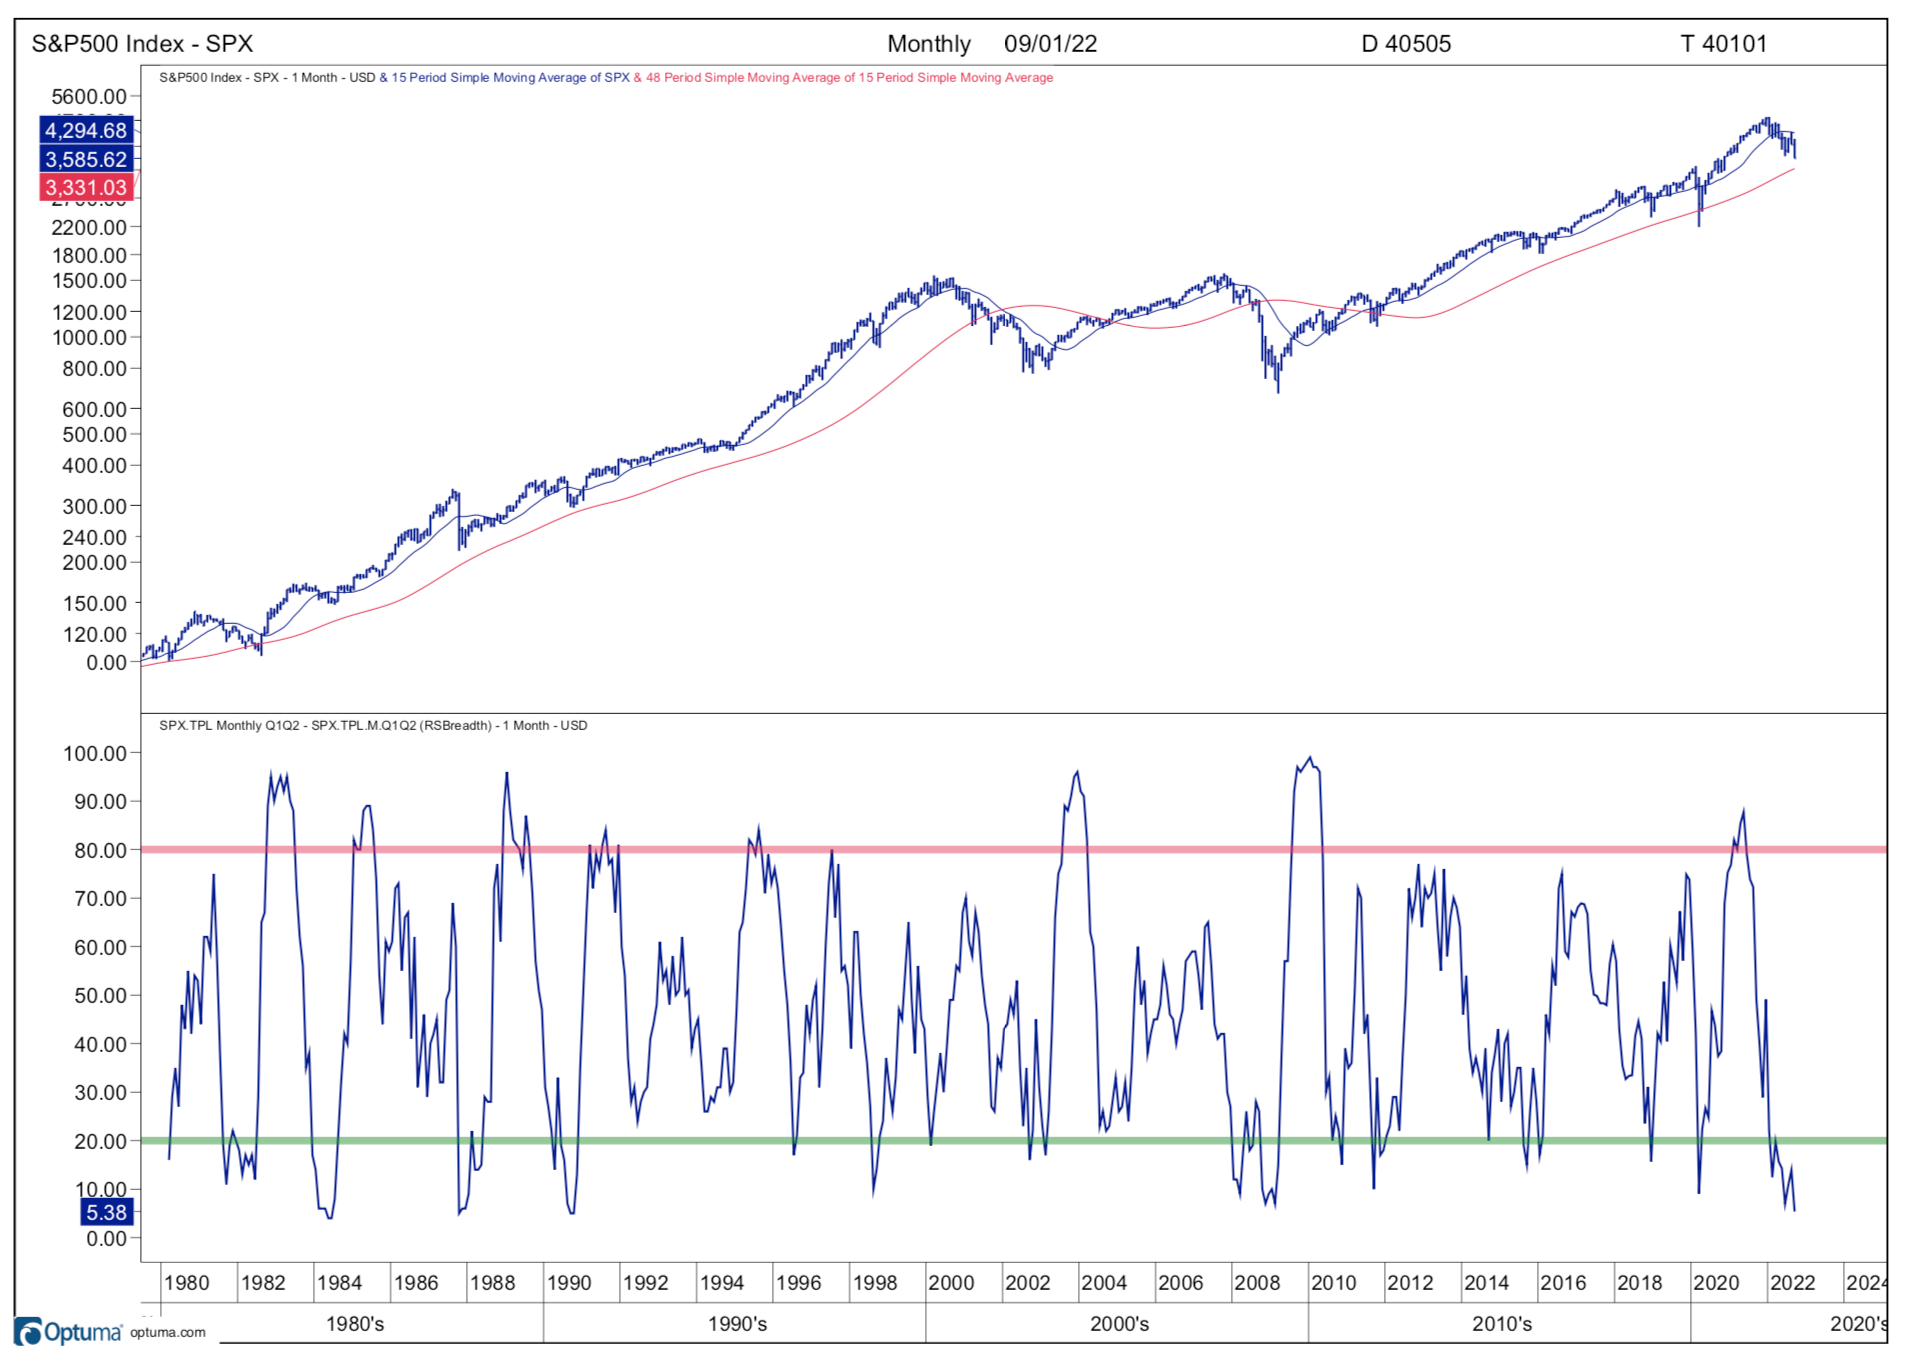
This is one of the main indicators I will be watching to confirm if a new longer term
uptrend has started. The blue line on the bottom shows the percentage of
stocks in the S&P 500 that are in an uptrend. When it falls below 20% (see the
bottom left hand side of the chart) and then turns up and rises above 20%, it is a
buy signal for the S&P 500. This is calculated at the start of every month. Only 5%
of stocks in the S&P 500 were in an uptrend on September 1st.
In order to eliminate almost every false signal, I have found it is best for the
S&P 500 AND the Canadian TSX indicators to drop below 20% and then rise
above 20% to produce the best possibility of success. Please see same indicator for
the TSX below.
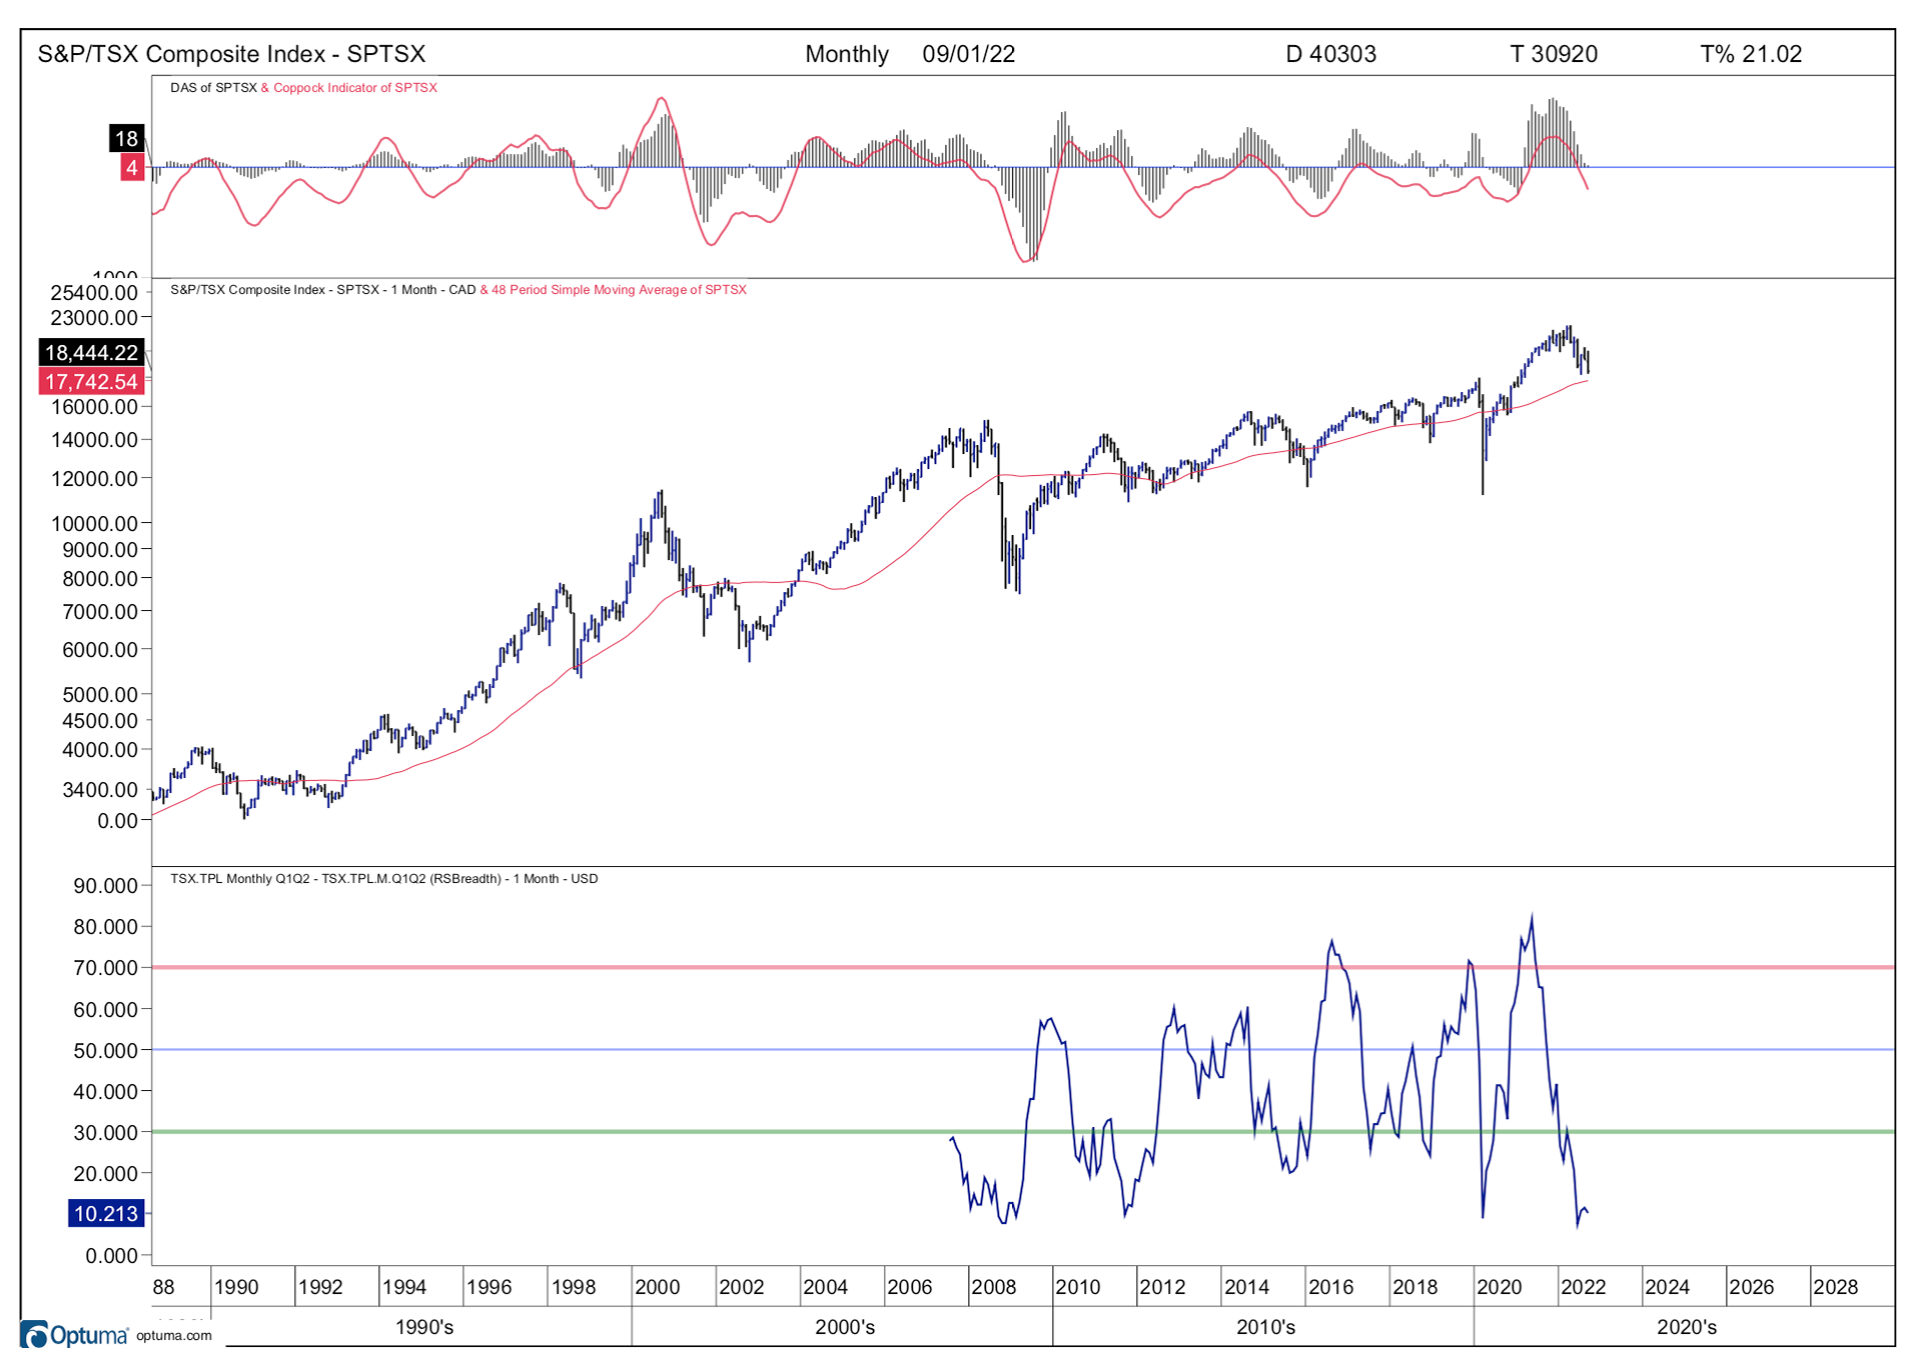
As of September 1, 2022, 10% of the stocks in the TSX were in an uptrend.
This is because the TSX has a larger proportion of energy stocks in it and they
have been helped by higher oil and natural gas prices. If today was the start of a
new uptrend, more than 20% of stocks in the S&P 500 and the TSX could be in an
uptrend by November 1st. That is what I will be watching for.
Thank you for your trust and confidence. I will continue to keep you informed
about the latest developments.
SAR Update
It has been unusually quiet for SAR calls since mid-August. On a recent Sunday
evening, we were called to look for a man who had wandered into the bush looking
for his missing dog. Although the dog returned, the man was reported missing after
being gone a number of hours. We travelled 20 km on gravel roads to get to the
scene and started searching in dense bush around 10 pm. Please see the photo below
that I took to show you what I was seeing at eye level and had to walk through.

I used the headlamp on my helmet for visibility and a compass on my iPhone for
direction to try to go in as straight a line as possible. We all stopped at regular
intervals to blow our whistles to hear if there was any response from the man. We
arrived at a river and followed the riverbank down to the lake after covering most
of the area that was surrounded by roads or water. We saw and heard nothing so
we suspended our search at 1:30 am. By the time I got home and had a shower
after being soaked in sweat, I got into bed at 3:30 am.
Since my team was out so late, we asked our colleagues at Chilliwack SAR to
continue the search Monday morning. The man we were looking for walked out of
the bush shortly after they arrived in the morning. He said he had seen our lights
but decided not to respond to us.
While it was rather frustrating and disappointing to hear that, at least we did
our job well by getting close enough to him in very difficult conditions. It was
also good to hear that he was alive and in good physical condition. We just never
know what to expect on these calls. After being out on more than 700 missions
over the last 20 years, I thought I have seen everything. What happens in the
markets may not surprise me but I am often surprised and confounded what I see
and experience on SAR calls. I don’t think that will ever change.
I hope you stay safe out there and have a great weekend my friend!