

 This is How Our Mind Plays Tricks on Us
The human mind is capable of doing amazing things. However, in some
ways, it is sadly lacking. Dr. Robert Koester has done research for search and
rescue personal as a leading expert on the behaviour of lost people. One of the things
Dr. Koester did as part of his research was to ask people to walk in a
straight line while blindfolded. While we think this should be fairly easy, the
actual path that we take is anything but straight. Please see this example from his
research showing the path that four different individuals took when asked to walk
in a straight line for 100 metres!
What does this show us? It tells us that our mind can sometimes lead us to
believe we are doing something totally opposite to what we should be doing or
what we believe we are doing. When blindfolded, we walk in circles instead of
straight lines. Yet, we are convinced we are walking in a straight line until we see
what we really did.
Our minds can cause us to come to false conclusions in other matters as well.
For example, when it relates to investing, we tend to think that the more prices
rise, the more they will rise in the future. We also tend to think that the more prices fall,
the more they will fall in the future. This is called recency bias. We all have to deal with
recency bias, which causes us to believe what has happened in the recent past will
continue into the future. This works against us as we try to determine a reversal in the
market trend.
In reality, when stock prices fall, they actually become more attractive, not less
attractive. Statistics compiled by Investors Intelligence over the last 50 years
shows a very consistent pattern. Experts and investors become more optimistic as
prices rise and more pessimistic as prices fall. At times of extreme pessimism, so
many experts are saying that prices are likely to fall further. When we listen to
these forecasts, it makes it feel like stock markets are going to fall much more.
The only problem is that history shows feeling like stock prices are going to fall
much more at extreme levels of pessimism is like believing we are walking in a
straight line when in fact we are walking in circles. What has happened in the past
shows high levels of pessimism actually occur at market bottoms, not before
much larger declines. This means that the risk actually declines as pessimism
grows, not the other way around. You can see this in the most recent chart from
Investors Intelligence on the next page.
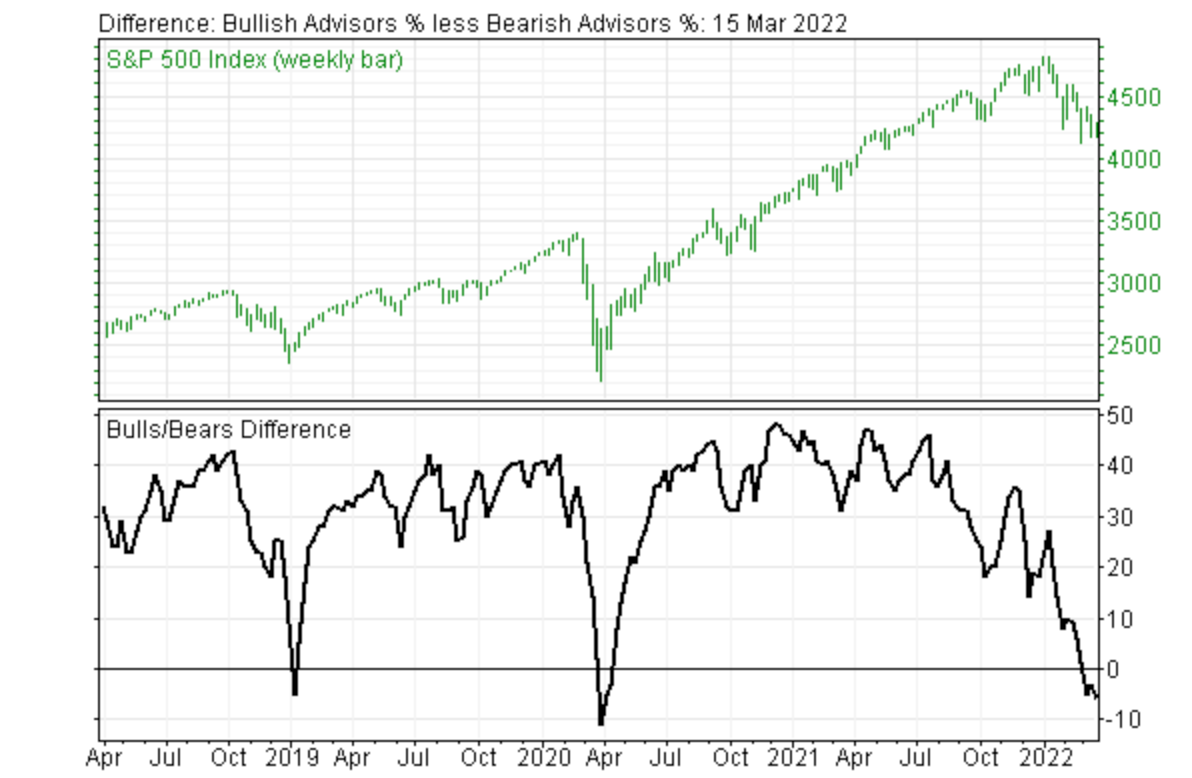
The green chart on the top shows the level of the S&P 500 Index of 500 large
US companies since April 2018. The black line below rises as optimism increases
and falls as it decreases. When the black line falls below 0%, it means we are
hearing more pessimistic stock market forecasts than positive ones. You can see
this happened when the S&P 500 19% decline ended in January 2018 and when
the Covid-19 sell-off ended in late March 2020. It is at -5.9% now.
It is easy for us to accept that markets figures of -5% or -10% in the black line
have lead to market bottoms in the past. It is much more challenging to accept
that current levels of pessimism will also occur near a market low now. You see,
we know how the corrections in 2018 and 2020 played out, so the emotions of
stress, anxiety and uncertainty are absent.
When we are in the present situation, the emotions of anxiety and uncertainty
are front and center in addition to the real stress of watching men, women and
children suffer in a military conflict. It takes real effort to look at the facts and
ignore our emotions, just like it takes effort to focus on a compass when walking
in the dark and ignore our own intuition no matter how powerful our inner voice
is. What has happened to stock markets in the past are statistics absent of
emotions. What happens in the present fills us all with various emotions that we
must deal with.
Warren Buffett summed it all up when he said, “Be fearful when others are
greedy and be greedy when others are fearful.” This is a very useful rule to
follow. But, how much fear is enough fear to be “greedy?” There are two tools I
have found to be most useful to determine when there is enough fear to warrant
buying more investments. It is important to note that both of these tools are based
on the behaviour of investors and experts, not on economic or financial
information. The first is the sentiment data shown on the previous page. When the
level of optimism falls close the 10% level in a mild 5% to 10% correction or to
the 0% or below during a serious correction or bear market, that is a positive sign.
The second indicator I use to determine if there is enough fear to become greedy
is when the long-term oscillators for major market averages decline close to fully
oversold level and then turn up.
For example, the white line in the chart below is the long-term oscillator for
the S&P 500 going back five years. You can see that it dropped down to low
levels in November 2016, April 2018, December 2018, March 2020 and in
February of this year. (The red and green line is the level of the S&P 500.) There
were no double bottoms in 2018 and 2020 because markets responded to
significant comments or actions by the Federal Reserve. The Fed is not
intervening this time so markets are handling this correction in the natural way.
 Chart is from data provided by Refinitv
In a natural correction, where there is no major intervention by the Fed, the
selling needs to be exhausted before another uptrend can start. When this
oscillator (the white line) bottoms near a low level and turns up, it indicates that
the worst-case scenario has been factored into current prices. When that happens,
stock prices cannot really go down much more. Sometimes this oscillator will
form a double bottom just like stock markets typically do during a severe sell-off.
Warren Buffett followed his own advice to be greedy when others are fearful
soon after the Financial Crisis began in September 2008. The only problem was
that stock prices continued to crater until late November. He would have been
much better off had he waited for this long-term oscillator to bottom and turn up
again. This oscillator started declining in September 2008 and then bottomed and
turned up in late November 2008. US stock prices fell another 20% or so from late
September 2008 to November 21, 2008. That is why this is such a good indicator.
US stock prices have followed a normal pattern of experiencing a double
bottom this year. The first low was on January 24th and the second was a month
later. Usually they are six to eight weeks apart instead of only four weeks.
However, as of this Monday, March 14th, it has been seven weeks since the initial
low, so we are right within the typical time frame that is required for the selling of
stocks to reach the point where the selling is exhausted and the excess optimism
has been eliminated. If this long-term oscillator for the S&P 500 continues to rise
early next week, it could be a confirmation that this correction is over.
It was reported that US corporations have recently announced that they want to
buy back a record $238 billion of their shares this year to take advantage of this
market weakness. They are following Mr. Buffett’s advice. This will produce a lot
of buying power to drive prices higher once there is confidence that this
correction is over. Huge corporate share buyback programs are one of the reasons
why the S&P 500 has often rallied back to record highs four months or so after a
correction. I will keep you informed about how investors are behaving in the
markets.
This is what Warren Buffett said about buying his first stocks a few months
after Pearl Harbour when the US was losing ground in World War II. “I didn’t
buy it because I thought losing the war was a good idea. I bought it because I
thought stocks were cheap and that eventually we’d win the war, and the same
way in Europe.”
In summary, we may think that our thought processes are rational. However,
our mind can play tricks on us when we are blindfolded and asked to walk in a
straight line. It can also play tricks on us when our emotions are affected by
increasing pessimism about current events and stock market declines. When there
is more pessimism than optimism, we feel the risk of further declines is increasing
when it is actually decreasing. Investor behaviour and expert sentiment during this
correction has followed patterns similar to other corrections. Sentiment levels are
at levels where previous severe corrections have ended. The long-term oscillator
for the S&P 500 has bottomed and turned up for the second time, just like it has
when the worst-case scenario has already been factored into current prices before.
In my experience, these are the two most reliable indicators to determine when a
market decline ends and a new advance has started. According to Ned Davis
Research, when sentiment has been like this (from 1994 to the present), the
average gain after 12 months has been 28.2%. I will continue to keep you
informed.
SAR Update
It has been very quiet as far as SAR calls go until last weekend. We were asked
to go the Chehalis area to look for a 12-year-old boy who was missing all night. It
turns out that this boy and his mother went for a walk on a river delta and got lost.
They were not able to find their way out by nightfall so they spent Friday night
outside. The boy left to try to find a way out to get his mother’s medication but he
could not figure out how to find a way out. In the meantime, his mother was able
to find her way to where people were. At 11 am we were paged to help the local
band members look for the boy.
We call this area the Chehalis triangle named after the Bermuda triangle. There
are hundred of acres of flat gravel bars with smaller trees on them. While walking
on dirt produces trails that you can see, walking on gravel provides no markings
of where you have been. We usually have to find a few lost fishermen there every
year. One time we even had to rescue the same person twice!
Fortunately, the young boy was found on a gravel bar around 1 pm and carried
across the channel to civilization by a local man. That was a very happy ending
because surviving another night may have proved to be disastrous. Please see a
photo from Facebook on the next page.
 Our team responded to another incident on Wednesday but I am not able to share
details at this time. Perhaps I can by next week. Be safe and have a good
weekend!