As the markets reach all-time highs I am often presented with the question of whether now is a good time to invest. In a perfect world, I guess the market would appreciate at 8-12% per year on a steady and consistent basis meaning we would always be investing at all time highs. I recently came across a great article from John Girman at RBC Global Asset Management on the topic. I found it really interesting to see how well the market typically performs after breaking through all-time highs. I’ve summarized some of his thoughts below.
In 2023, investors were rewarded for staying the course in long-term investments despite temptations to move into short-term cash alternatives. Fixed income and equity markets both produced strong returns. Equity markets were led by the U.S., particularly mega-cap growth stocks, which helped the S&P 500 deliver a return of over 20% for the year. Momentum has generally continued into 2024 with the S&P 500 reaching a new all-time high on January 19th, and subsequently several more in the weeks that have followed.
With certain equity markets such as the S&P 500 now hovering around all-time highs, some investors may be questioning whether it’s the best time to put new money into the market. After all, investing at all-time highs means paying a price that no one has ever paid before – creating a seemingly guaranteed recipe for regret. You might be surprised to learn that typically, investors actually fare quite well after investing at all-time highs.
All-time highs are not unusual
First, it’s important to recognize how common all-time highs are. Since 1950 the S&P 500 has established 1,258 all-time highs along the path to its current level. That’s an average of over 17 every year.
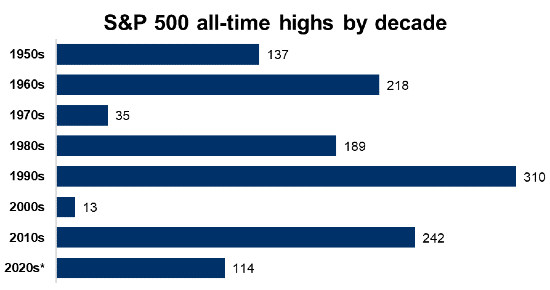
Source: Bloomberg, RBC GAM. Data as of January 1, 1950 to Feb 13, 2024.
What do market highs mean for investors?
New highs are a normal part of equity markets. Often they have to do with continued growth of the economy and corporate profits. While there are periods when the economy and markets slow down, over time improvements in productivity and innovation have continued to propel markets towards new highs.
Prior to January 19 this year, the last time the S&P 500 was at a high was on January 3, 2022 – just over two years ago. This is notable because as the chart below shows, large gaps between all-time highs tend to occur infrequently, and are typically followed by many clusters of new all-time highs. New highs also don’t necessarily warn of an impending correction. On average, investing at an all-time high tends to produce similar long-term returns when compared to investing on any other date.
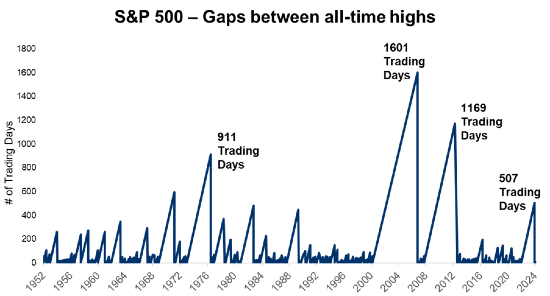
Source: Bloomberg, RBC GAM. Data reflects S&P 500 Total Return Index from January 1, 1951 to Feb 15, 2024.
What happens in the short-term after an all-time high?
We have just recently been through a 2-year stretch where the S&P 500 didn’t reach an all-time high. With this in mind, the below shows what has historically happened to the U.S. equity index in the year following a new high when it has gone at least a year without one.
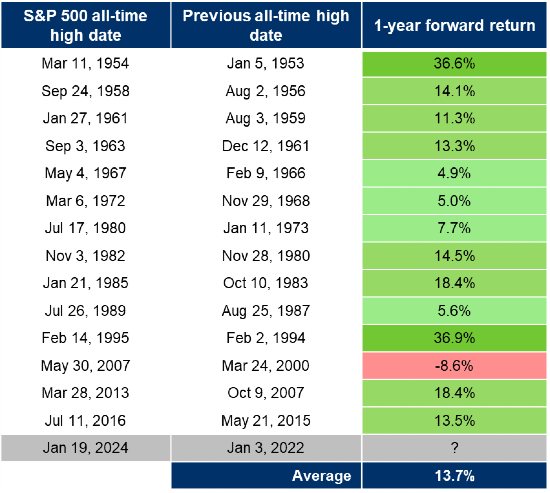
Source: Bloomberg, RBC GAM. Data as of January 1, 1950 to January 31, 2024 in US dollars.
Prior to January 2024, there had been 14 cases since 1950 where the S&P 500 reached a new all-time high after going at least one year without one. Over the following year the index was higher 13 out of 14 times, and on average was up 13.7%.
Maintaining a long-term perspective
While this trend supports an optimistic outlook, there’s no way of knowing with certainty what lies ahead in the near term. However, what history does tell us is that stocks tend to move higher over the long term. New highs are a normal occurrence and don’t necessarily warn of an impending correction. They may in fact signal that further growth lies ahead.