Finding the Real Killers
30-years ago this month, Orenthal James “O.J.” Simpson was found not guilty of murdering his ex-wife Nicole Brown Simpson and her friend Ronald Goldman – despite what seemed to many, to be overwhelming evidence to the contrary. The case captivated much of the world for the better part of 16-months, beginning in June of 1994 with O.J. and his friend Al Cowlings low speed pursuit on the 405 freeway in O.J.’s white Ford Bronco. This was the same day/night that the New York Knicks and Houston Rockets were batting for the NBA title and the New York Rangers were celebrating their first and only Stanley Cup in the past 85-years (yes, the Leafs are not the only ones) in the Canyon of Heroes in downtown Manhattan (let’s just say I might have had one or two or twelve malt beverages that day in the Canyon). In many ways, the trial and the 24/7 news coverage were a precursor to many bad things to come in the next 30-years. This does not mean we would not have had social media, Keeping up with the Kardashians, Donald Trump and all the rest “but for O.J.”, but rather that the trial, the way it divided the country mainly along racial lines and the chaotic daily stupidity that arose from it rhymes an awful lot with the world in 2025. O.J. vowed in the wake of his acquittal to find the real killers and while he searched high and low on golf courses and in casinos across the country, he passed away in 2024 without ever revealing who really did it.
Anyway, as we approach one-year since Election Day 2024, we thought now would be a good time to do a temperature check on markets and the economy. There is a famous quote from the 1950s (author unknown) that goes: "Bull markets climb a wall of worry; bear markets slide down a river of hope". While we could enumerate a number of worries at the present time, we will instead restrict our focus to the current state of the economy and our thoughts on a stock market that seems willing to ignore many bad things.
The Economy
As we have written for some time, the U.S. economy and by extension the global economy is in a weird spot. The on-again/off-again tariffs have caused a stop/start nature to inventory purchases (let’s buy ahead of tariffs and stop buying right after the deadline), which has wreaked havoc with the data. Add to this the U.S. government shutdown, which has quite literally halted the flow of official data out of the U.S., and what we are left with is a mosaic of information that needs to be pieced together in order to create a cogent narrative (we apologize for the word salad, but “cogent” was the vocabulary word of the day, so we felt compelled to use it cogently).
Jobs: Let’s start with the jobs market. There was no non-farm payroll release for October because the U.S. can apparently not walk and chew gum at the same time when the government is shutdown, so we will try to make sense of where we are without full information. Let’s start with a chart and then comment:
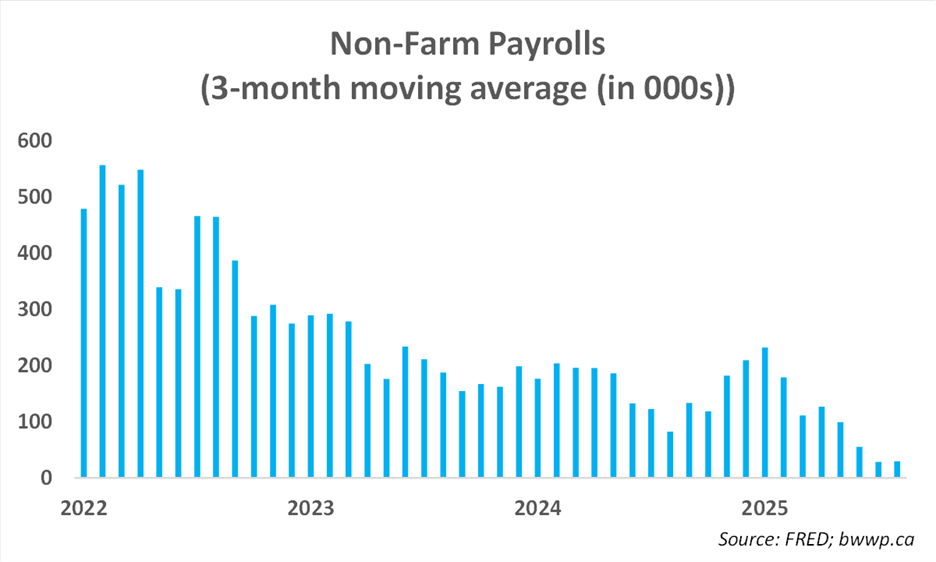
As you can see, through the end of August, job growth in the U.S. had slowed to ~30k/month from a run rate of closer to 150k month over the prior couple of years. Back in our days in Capital Markets, we used to make the case to client groups that while you could worry about a lot of things, if you wanted to worry about just one thing it would be job creation as an economy that is not creating enough jobs to employ its citizens has a serious problem. Further, in an economy and a job market as large as the U.S. (there are ~160 million Americans in the workforce), the economy needs to create ~150,000 jobs every month just to stand still. Why 150k? Historically, the U.S. has created new households (people entering the workforce) to the tune of about 1% of the total workforce, which is about 1.6 million per year or about 150k/month give or take.
Anything substantially less than this 150k figure would represent a job market that was contracting, while anything close to zero or even negative would start to indicate that the broader economy was contracting (i.e. in recession territory). So, on its face, the 30k average the U.S. has been running since the Spring would, in normal times, be a fairly dire warning sign. But these are not normal times. Let’s look at another chart and then comment:
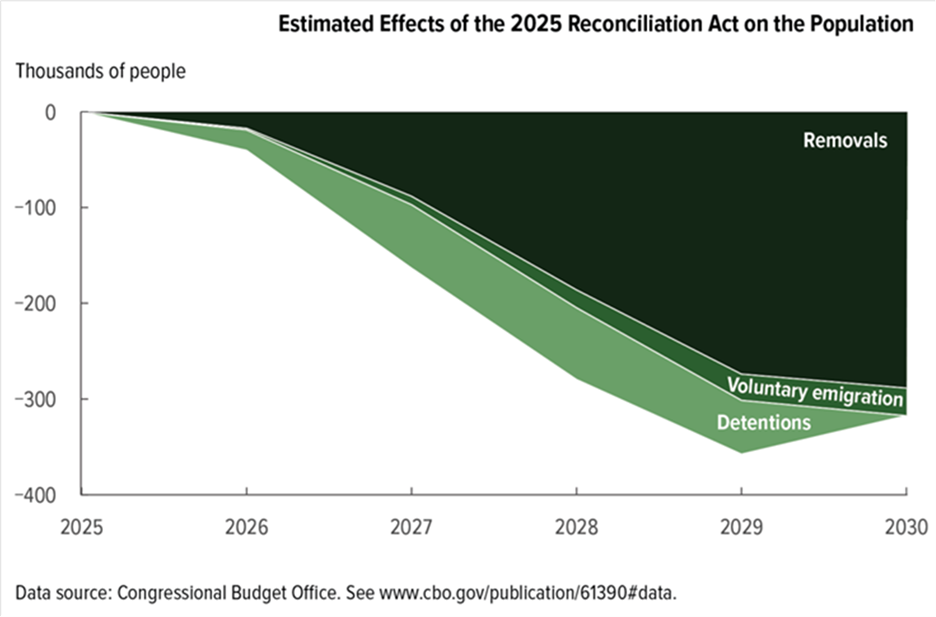
For the first time in its history, the U.S. could potentially see its population decline in 2025. This is largely because net immigration has turned negative, while births minus deaths is not enough to offset this. Thus, the ~1.6 million households that the U.S. would need to create in normal times has likely been substantially reduced, meaning that absent any other effects, the 150k monthly run rate is likely also substantially lower. But let’s also add this:
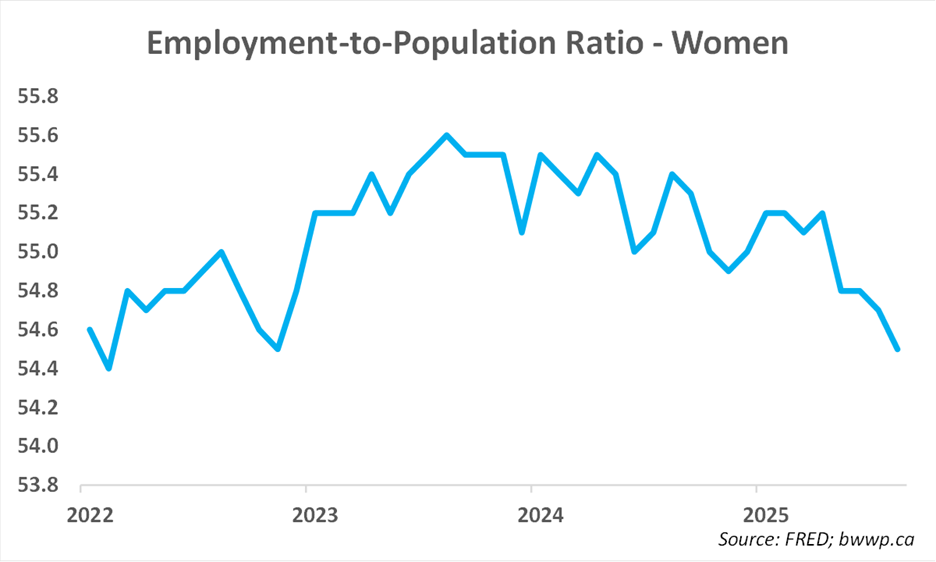
Negative immigration also appears to have had a negative impact on women in the workforce as childcare has become significantly more difficult to obtain. When we add this to the above, it is not hard to make the case that the “new normal” for job creation in the U.S. may be a lot closer to the current run rate of ~30k/month as opposed to the traditional 150k. In other words, while our narrative around jobs would traditionally have been fairly dire given the current data, we do not believe the current situation carries the same recession warning signs.
Growth: One of the big net effects of essentially shrinking the workforce is that “normal” growth for the U.S. has also shifted lower. Let’s look at a chart and then comment:
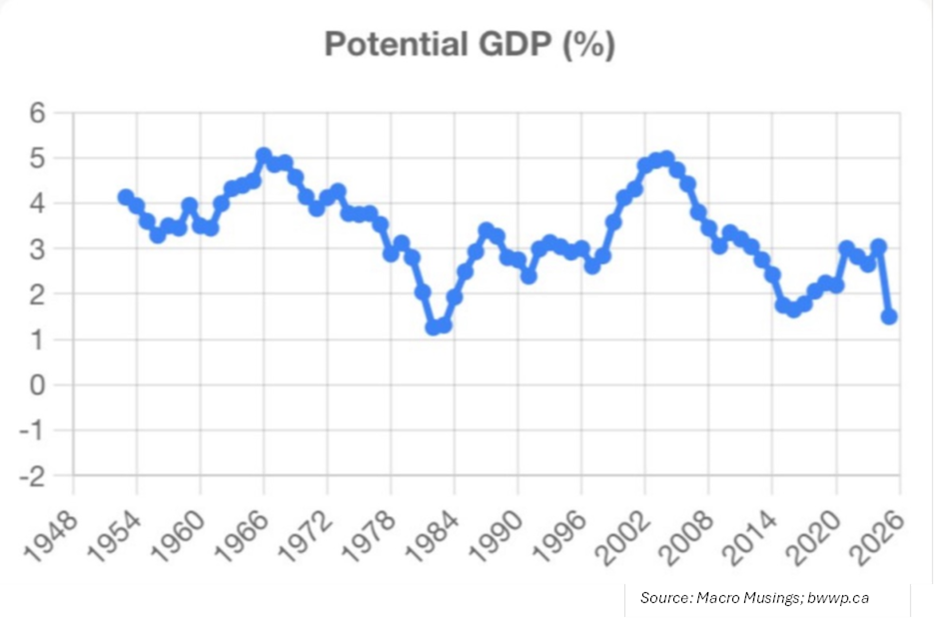
Normalized growth is now ~1.5% in the U.S., which essentially means that for the economy to create the ~30k monthly jobs necessary to achieve full employment, growth does not need to be much more than this level. Anything above this rate of growth would indicate an economy that is running hot, which has the potential to upend the supply/demand balance and thus stoke inflation. Before we get to inflation, let’s take a look at one more chart:
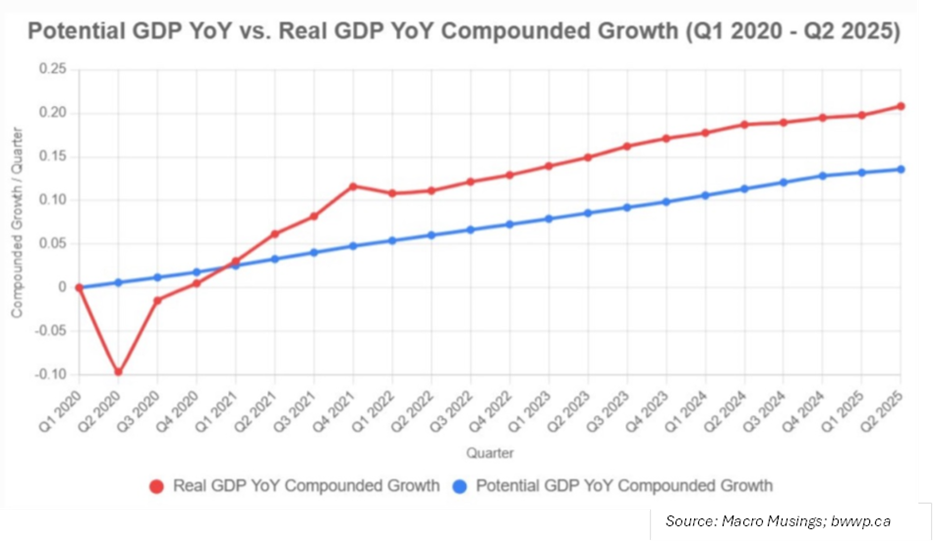
Here, we have overlayed actual GDP growth (red line) and potential GDP growth (blue line). Potential GDP growth is what the normally function economy should generate in growth absent any stimulus or constraints to growth. As you can see, the U.S. economy has been “running hot” since Covid and you can even see a slight further divergence (potential flattening vs. actual steepening) in the most recent quarter. This “over-growth” helped to stoke the inflation outburst in 2022 and has the potential to do so again. Now, as we mentioned earlier, the on-again/off-again tariffs and the government shutdown have made getting a good read on the economy challenging, but from the data that has come in, it is largely pointing to growth of closer to 3%, which, again, would be running pretty hot vs. potential.
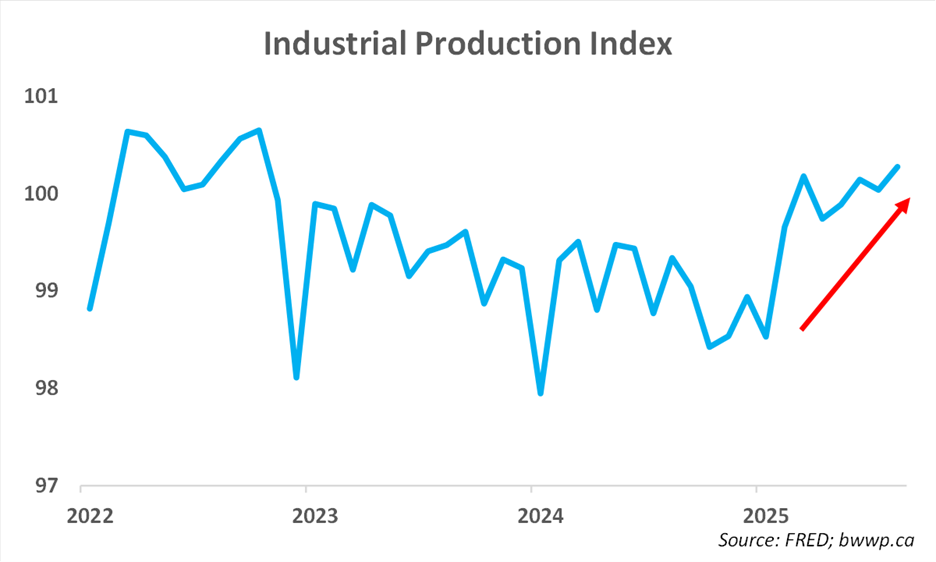
Again, as you can see, industrial production has moved higher over the past several months – whether or not this is sustainable remains to be seen, but there is no evidence that the economy is struggling in any way.
Inflation: The above creates a great, big elephant in the room – run hot for too long and you are going to create an inflation problem. As we have noted previously, money supply, which increases when lending picks up, has been growing at north of 4%, which generally feeds through to inflation with roughly a 12-18 month lag. Why?: banks lend more because economy is strong and credit conditions are loosening, this increases the money supply as every dollar in the system is essentially being multiplied by this increased lending/borrowing, inflation eventually becomes an issue as the increased dollars in the system represent demand for stuff, while the supply of stuff cannot keep up. Here’s an update of a chart we have run before:
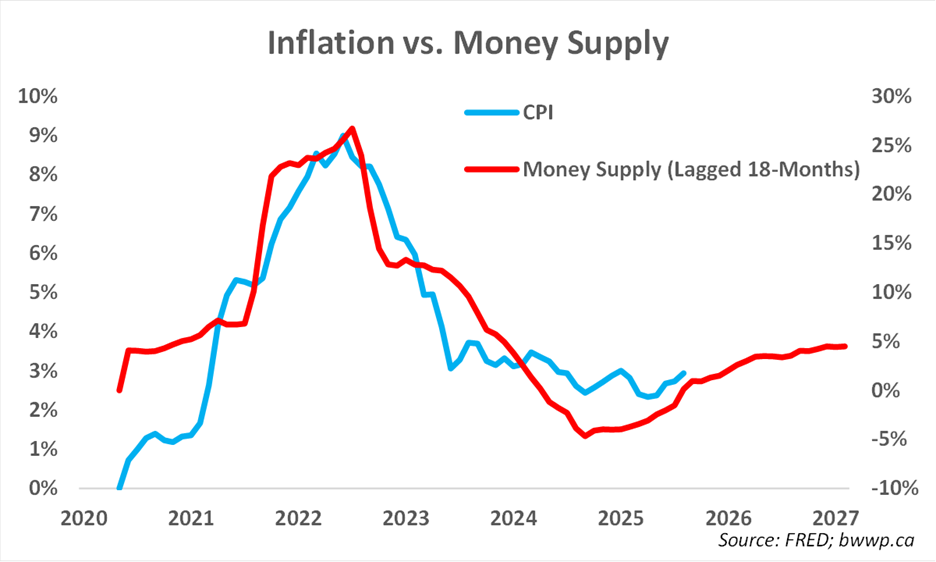
So, the growth in the money supply implies inflation, which is running around 3%, could be closer to 5% late next year. And the above is without the added fuel of Fed rate cuts, which began again in September and continued this week. While we generally try to avoid hyperbole, we are going to lean on some here – the Fed rate cuts are likely to continue into early 2026, may go down as the single biggest mistake the Fed has made in decades. We say this for the simple reason that the U.S. economy unequivocally does not need them.
The Fed has a dual mandate of full employment and price stability (i.e. avoid big inflation), but it has completely ignored the second in favor of the first. And, as we noted above, there is nothing wrong with the job market – or at least nothing that rate cuts is going to help solve (unless ICE takes rate cuts as a sign it should stop deporting workers). The rate cuts, coupled with the One Big, Beautiful Bill, has added rocket fuel to the economy, to the point that financial conditions are as loose as they have been in some time (note that looser conditions are defined by bigger negative values):
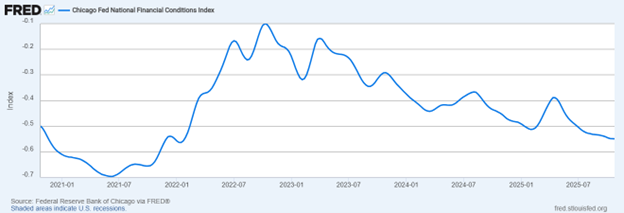
This is great for risk assets – i.e. stocks, crypto, gold – but ultimately bad for inflation, which is why we continue to worry that we are going to wake up to an inflation issue in 2026. Okay, let’s transition to markets.
Markets
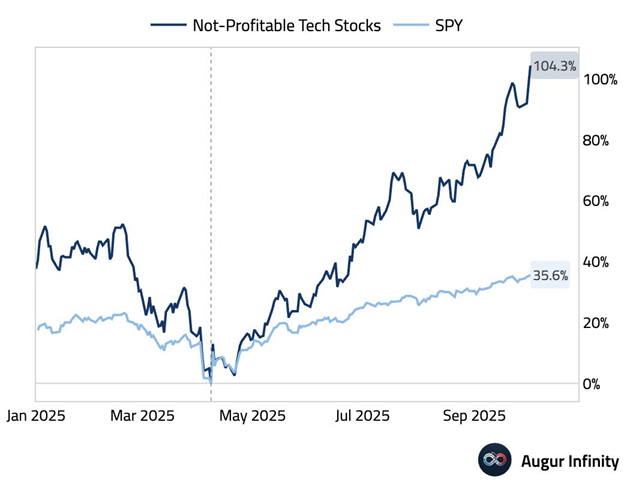
We are living in a challenging period for portfolio managers like ourselves, which tend to focus on quality businesses with strong free cash flow, good management teams and reasonable valuations. While the major indices have done well, it has largely been either the Mag 7 stocks, which we own, but at significantly lower percentages than their weightings in the index, or lower quality businesses that tend to benefit during periods of high liquidity (i.e. very loose financial conditions).
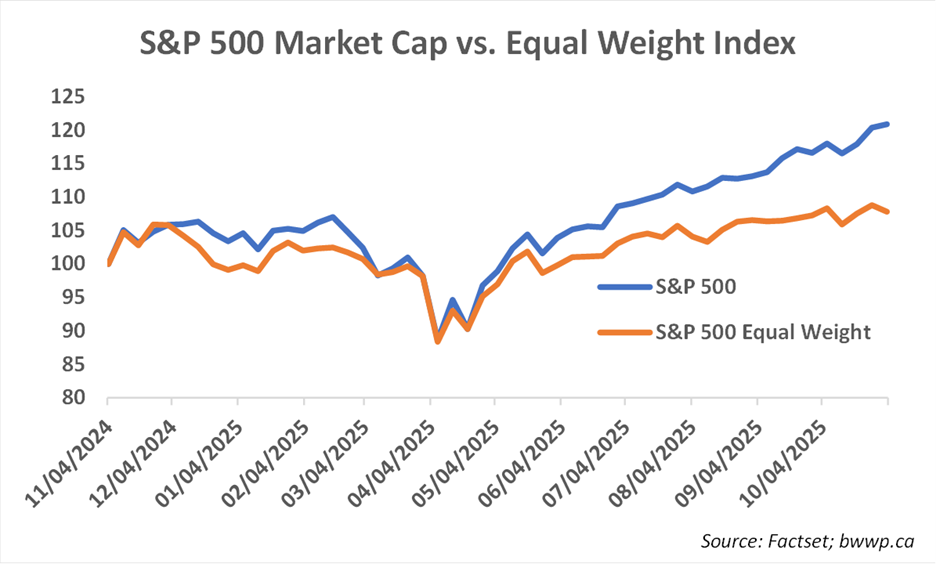
To put it in some perspective, while the S&P 500 on a market cap weighted basis is up ~21% over the past 12-months, the equal-weighted index is up only 8%. In other words, the average stock has been okay, but the cap-weighted nature of the S&P 500 masks this as a small group of stocks have propelled it significantly higher.
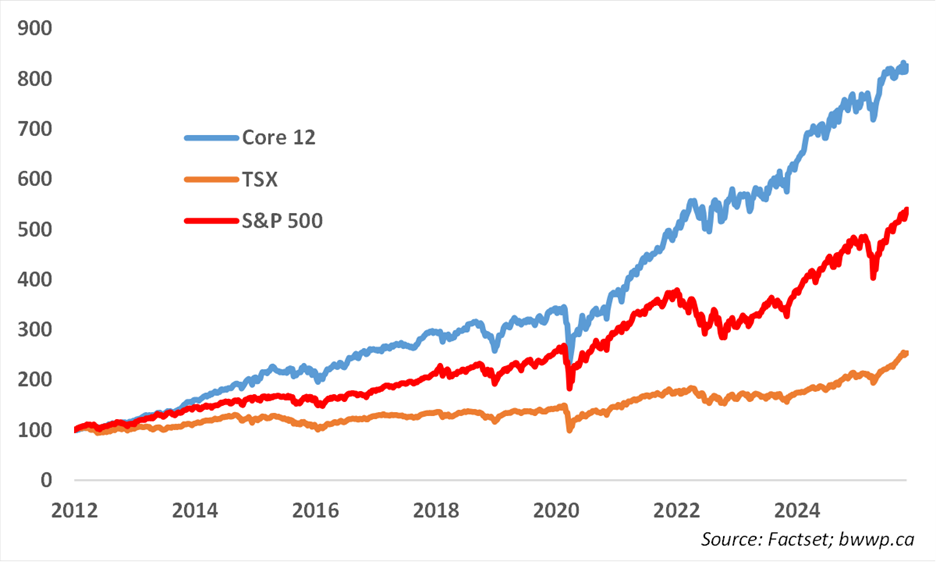
As for Canada, the TSX continues to be led mainly by gold stocks, which do not fit our fundamental screens for quality. Our Core 12-names, which we believe are the best of the best amongst Canadian companies and have had a great long-term track record of outperforming not only the TSX, but also the S&P 500, have lagged in 2025. We own these across our portfolios and believe very strongly in these businesses, so while 2025 has been a bit of a disappointment, we are undeterred:
Thus, while we are well-protected from the eventual correction that will come as inflation worries rise and financial conditions tighten, 2025 has been a challenge from a performance perspective. We have met or exceeded our annual goals in terms of targeted returns – 6-8% net of fees for a balanced portfolio of stocks, bonds and alternatives – so from that perspective, we are content, but we have lagged overall performance by more than we have traditionally been accustomed to in strong markets. That said - we expect to lag when markets get wonky and then more than make up for it when they get sloppy, and we do not plan to alter our approach in order to chase what we view as unsustainable.
Bottom Line: We remain in a window of strong economic growth and negative headlines. Our biggest concern remains inflation and the potential set-up for mid to late 2026 when a combination of strong growth and loose financial conditions threaten to stoke an inflation episode similar to the one experienced in 2022. That said – we remain in a favorable window at present and while our mix of quality businesses is not necessarily the big winners in an environment such as this, we remain steadfast in our approach, as we believe in will ultimately pay-off in the end. We remain nimble to the incoming data and will pivot if the need arises.