In homage to the late, great Brian Wilson, let’s look back at the most magical “year” in music history. We put “year” in quotes as the period we will focus on was not a calendar year, but rather a 12-month period that changed music forever.
August 1965 to August 1966: Come for The Beatles, Stay for the Dylan
Our year begins nearly 60-years ago – in August of 1965 – with the release of the Beatles Help! (266th on Rolling Stones list of top 500 albums of all-time) and Bob Dylan’s Highway 61 Revisited (18th). Help! is not even a top five Beatles album, but it not only contains the eponymous “Help!” not to mention “Ticket to Ride”, but also “Yesterday”, which is literally the most covered song of all-time (seriously – Google “most covered song of all time”). Highway 61, while only 18th on Rolling Stone’s list, is considered by most Dylan-stans to be his best with Dylan describing what it’s like to be a “rolling stone.” Think about that – “Yesterday” (ranked 13th on Rolling Stones list of the Top 500 songs of all-time) and “Like a Rolling Stone” (ranked 1st!) released in the same month … and as they say – we’re off.
- September – November, 1965: This three month “lull” gives us a middling Rolling Stones album that also happens to contain “Satisfaction” (2nd on Rolling Stones’ Top 500 song list), which was the Stones first ever number one U.S. song and Smokey Robinson’s Going to a Go Go, which slotted at 412th on the Rolling Stone list and also contained “Tracks of My Tears” (50th on Rolling Stones’ Top 500 song list).
- December 1965: Just an absolutely iconic month for music with The Beatles Rubber Soul (35th), The Who’s My Generation, The Rolling Stone’s December’s Children (which brought us “Get off my Cloud” and “As Tears go by”), and The Byrds’ Turn, Turn, Turn. Like August, we got a list of songs that included the 11th (the eponymous “My Generation”), 23rd (the Beatles “In My Life”), and 79th (the Byrd’s cover of Dylan’s “Mr. Tambourine Man”) best songs of all-time.
- January – April 1966: Again, a bit of a lull, but still got the debut album from the Golden Gord, Gordon Lightfoot (also RIP), the debut album from the Mama’s and the Papa’s (112th on the Rolling Stone list), and Nancy’ Sinatra’s debut Boots, which contains Vietnam War movie staple “These Boots were made for Walkin’”, which is exactly what we’ll do, because one of these days these boots are gonna (okay, we’ll stop).
- May 1966: We finally get to our homage with Brian Wilson and The Beach Boys’ magnum opus Pet Sounds, which is second on Rolling Stones’ album list. This album was so good that it not only contained the 25th, 211th and 271st songs on Rolling Stones’ song list, but also an outtake from the recording sessions – “Good Vibrations” – didn’t even make the album and ended up 6th on Rolling Stones’ song list (maybe the greatest flex in music history).
- June/July 1966: Nothing of note (kidding), except what many consider Bob Dylan’s second greatest album – Blonde on Blonde (38th on Rolling Stones’ list – imagine releasing the 18th and 38th greatest albums of all time in a 10-month period – although, the Beatles are about to say, “hold my beer”).
- August 1966: Like December of ’65, it’s headlined by a Beatles album – Revolver (11th on Rolling Stones’ list – giving the boys from Liverpool the 11th and 35th greatest albums of all-time in a nine-month period) – but also brought us the debut album from Jefferson Airplane.
So, if you are scoring at home – over an iconic “year”, we got four of the top forty albums of all-time, eight of the top fifty songs of all-time, plus numerous debut albums, not to mention “Like a Rolling Stone”, “Satisfaction”, “My Generation”, “Tracks of My Tears”, “These Boots were made for Walkin’”, as well as the most covered song of all-time. Anyway, rest in peace, Mr. Wilson.
Telling the Story with Charts
It’s been a few weeks since we have written anything (let’s chalk it up to information overload), so rather than focus on any one issue, let’s bounce around a few different topics using some charts to help with this story. Let’s start with U.S. jobs, which continue to print decent numbers; although, they may be both better and worse than they appear:
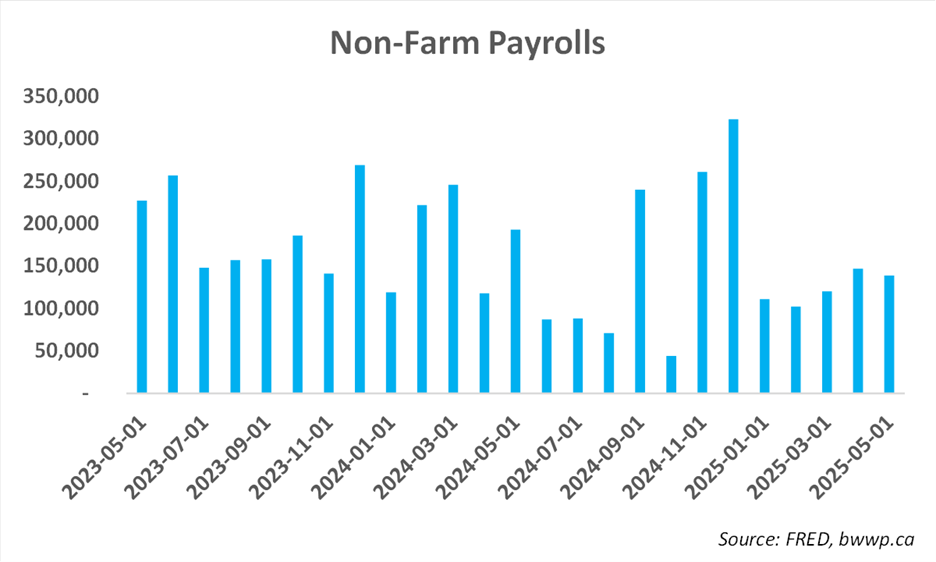
Jobs have stayed pretty steady between 100-150k, which is a bit below what experts believe is “steady state” for the U.S. job market. This steady state figure is often thought to be between 150-200k and represents the number of jobs the U.S. economy needs to generate each month such that the unemployment rate does not rise. However, while current levels are below this, the steady state may, in fact, be lower given the mass deportations the Trump Administration is undertaking, which has effectively lowered the pool of available labor. In other words, the jobs picture may be better than current numbers suggest. On the flip side, there is this:
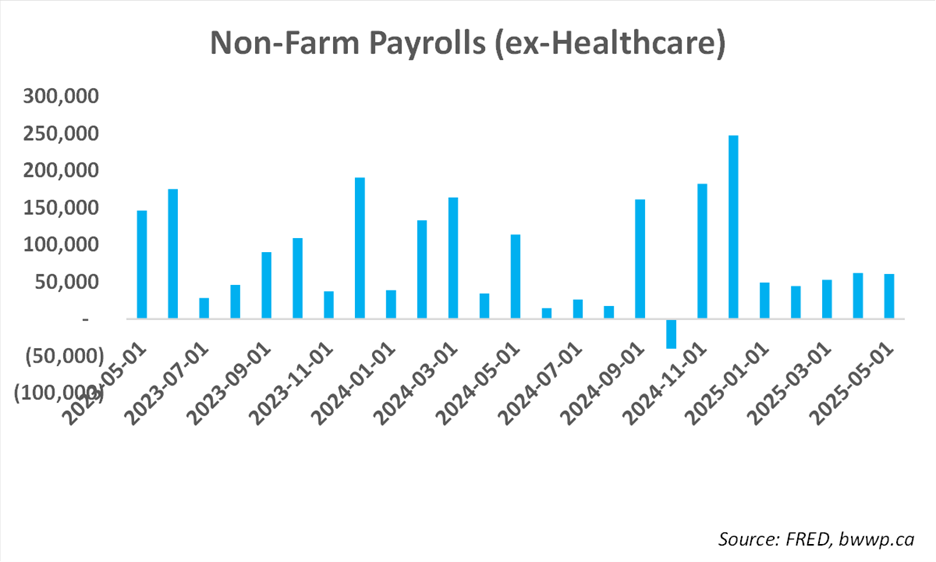
If we strip out jobs in the Healthcare field, the U.S. economy is not creating many jobs at all (around 50k per month in 2025), so while the overall numbers look fine, the gains have not been widespread. Okay, let’s pivot to tariffs and get a sense for where things are at as the 90-day pause deadline approaches:
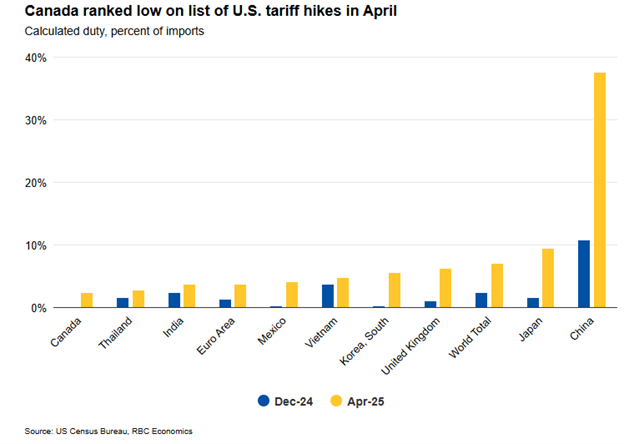
Most Canadian exports to the U.S. remain exempt because of CUSMA. In fact, RBC Economics estimates that ~86% of Canadian exports to the U.S. are currently exempt and while the tariffs on the remaining ~14% (steel and aluminum the big ones) bring the overall blended tariff to ~2.3% on all goods, this remains well below the levels for most other trading partners. This could change post the end of the 90-day pause but given Trump’s proclivity for backing off after making threats, we would argue the base case is that overall tariffs on Canadian goods will remain low.
While we are on the subject of Canada, we have harped for a while on the need for a major pivot to attract business to our shores, the chart below captures the difference between Ireland, which adopted a number of pro-business policies, including significantly reducing its corporate tax rate beginning in 1997 (it is now 12.5%), and Canada, which has taken a decidedly less pro-business approach:
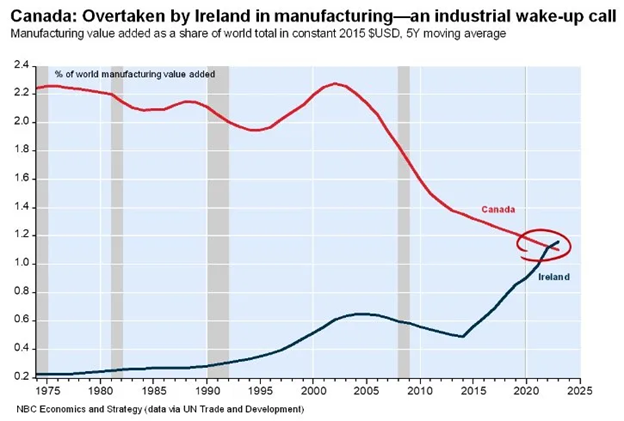
Considering that Ireland has 1/8th the population of Canada and limited natural resources when compared to Canada, the above shift is even more stark. Okay, let’s give a bit of good news on the Canadian economy. Much has been written (including by us) about the indebtedness of the Canadian consumer. Let’s look at a chart that has two panes and then comment:
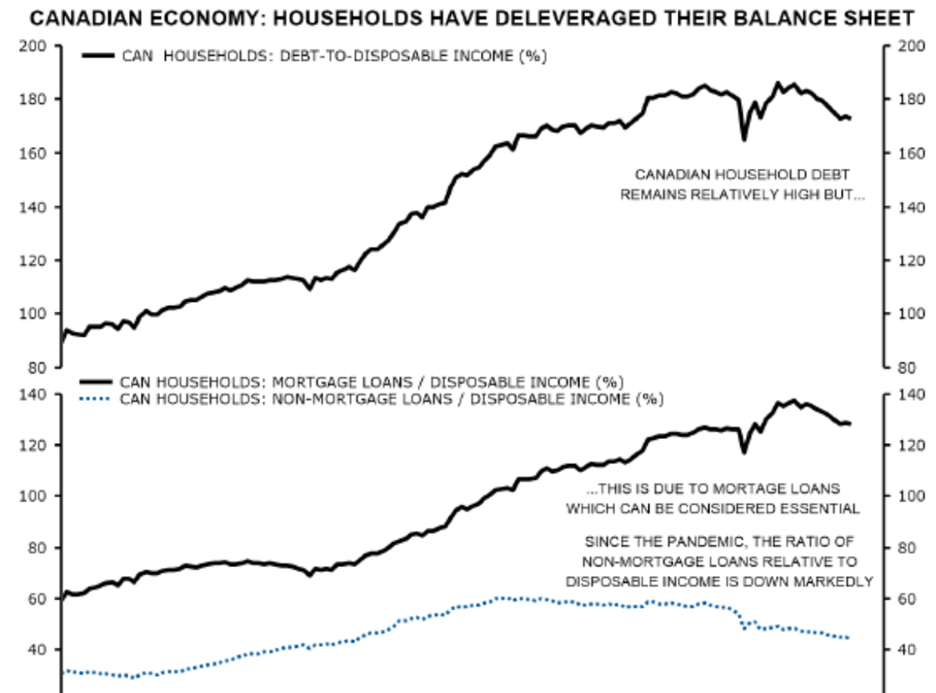
The top pane is the one that we are well familiar with – debt to disposable income, which remains about 60% higher than it was 20-years ago. However, ~75% of this debt is mortgage debt, which is tied to an asset that tends to have rather safe long-term characteristics (i.e. home prices tend to rise over time). The other piece, which is mainly in the form of home equity loans, has been in steady decline (the blue dotted line in the second pane) with overall non-mortgage debt at 12-year lows. In other words, while the picture is not great, it is not nearly as bad as the headlines might suggest.
Okay, let’s finish off with our favorite chart, which we will dub “The Domino’s Pizza Indicator”. While prediction markets saw a less than 50% chance that Israel would launch an attack against Iran, the Domino’s Pizza Indicator seemed to indicate that something was afoot:
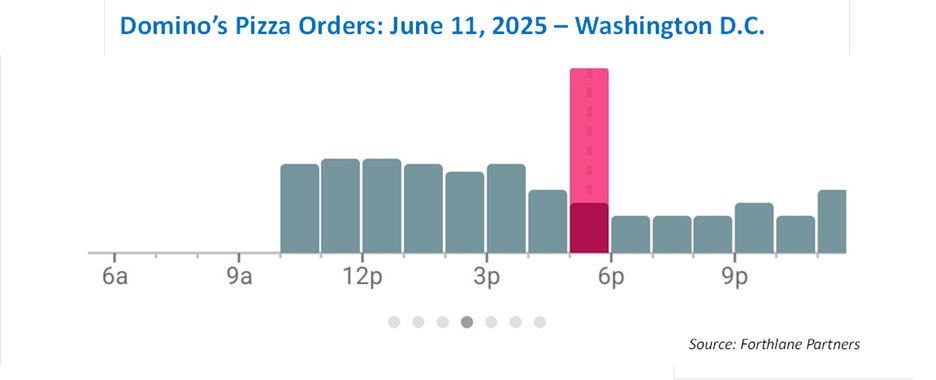
The grey bars are the normal ordering patterns for these delicious pies at the Domino’s Pizza closest to the Pentagon. However, there was an abnormal spike last week in the 6pm hour (the red bar), which may have been indicative that many in U.S. intelligence were working late on some file, which was most likely Israel-Iran.
Final Thoughts: Other than pizza patterns, we have a decidedly neutral stance on the current state of affairs. Tariffs continue to act as an overhang to investment, inflation, and economic growth, but the base case is that tariffs will likely be much more muted than initially feared and the U.S. economy will be able to avoid recession. With the recovery in stocks since mid-April, we are mostly comfortable with our positioning; although, with a variety of moving parts, including tariffs, inflation, Israel/Iran, and potential for U.S. and global stimulus, we would not be surprised to see some volatility (and potential opportunities to add to good businesses at distressed prices) as the summer plays out.