
Key points
- Markets have swung from expecting a large number of central bank rate cuts at the beginning of the year to much fewer, and with a growing divergence seen between major global central banks.
- The Federal Reserve has likely shifted from leader to laggard, as it could be the last to ease policy rates. We think that will have its own ramifications—domestically and globally.
- While the rate cut outlook remains volatile, a resumption of rate hike cycles remains highly unlikely. But the recent repricing of the outlook could present another opportunity for bond investors.
Of the four major central banks, [the Federal Reserve (Fed), European Central Bank (ECB), Bank of England (BoE), and Bank of Canada (BoC)], the last to raise rates was the ECB in September 2023. The others have been on hold since this past summer. But given another sharp rise in bond yields, investors would perhaps be forgiven if they believed we were still deep in the midst of central bank rate hike cycles.
At one point in January of this year, markets had priced in a view that the Fed would be cutting rates nearly seven times in 2024, thereby taking rates all the way down to 3.75 percent from 5.50 percent. It was a similar story globally as deep rate cuts were expected. In a sharp reversal, markets have repriced expectations which now suggest just two rate cuts from the Fed this year, and that at no point over at least the next three years will the Fed cut rates below 4.00 percent.
As the chart below shows, this idea that any rate cut cycle will be a shallow one has permeated across the central bank landscape. Seemingly gone are the days of zero—or even negative—interest rate policies in the years ahead.
As central banks edge closer to rate cuts, markets expect a shallow rate cut path in coming years
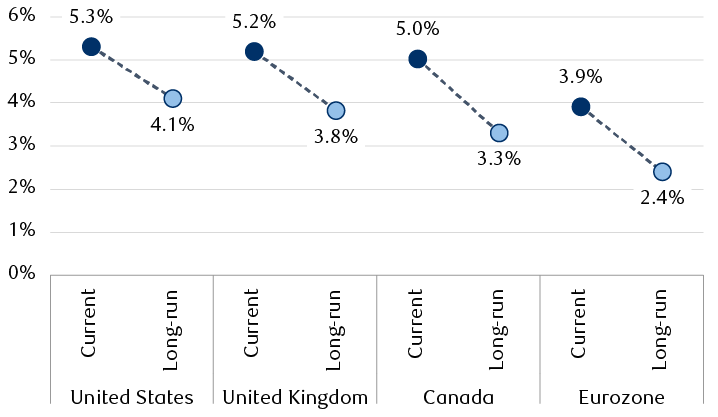
The chart shows the current policy rates for major central banks relative to what market pricing suggests banks will lower rates to in the years ahead, based on forward contract data. In the United States, the current 5.3% policy rate is expected to fall to 4.1%. In the United Kingdom, the current policy rate of 5.2% is expected to fall to 3.8%. In Canada, the current policy rate of 5.0% is expected to fall to 3.3%. In the eurozone, the current policy rate of 3.9% is expected to fall to 2.5%.
Note: Long-run market-implied policy rate based on three-year forward contract data.
Source - RBC Wealth Management, Bloomberg; data as of 4/16/24
Such are the mood swings of markets.
Inflation, unsurprisingly, is at the heart of the matter. Fading inflationary pressures in the back half of 2023, both in the U.S. and globally, paired with dovish commentary out of central banks, drove bond yields sharply lower. But with the inflation data broadly failing to show further improvement thus far in 2024, particularly in the U.S., sentiment has reversed. As the chart below shows, after falling to multi-month lows this past December, bond yields are now potentially on the cusp of re-testing the decade-plus highs achieved last fall.
U.S. and global bond yields could retest multiyear highs
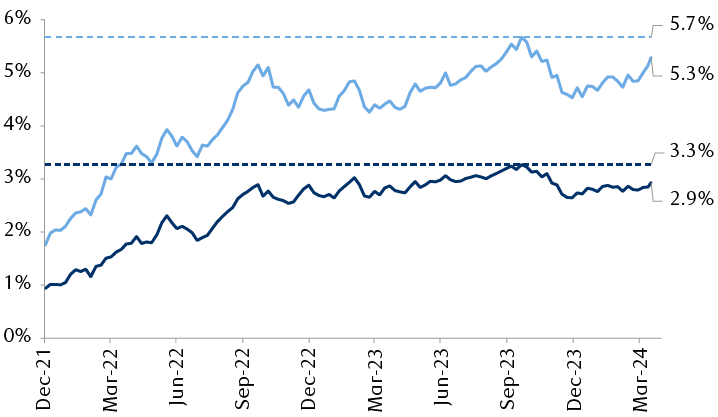
The line chart shows U.S. and global (excluding the U.S.) aggregate index bond yields, which include sovereign and corporate bonds, since December 2021. The U.S. yield is now 5.3%, compared to a period maximum of 5.7%. The global yield is now 2.9%, compared to a period maximum of 3.3%.
Source - RBC Wealth Management, Bloomberg U.S. Aggregate Bond Index, Bloomberg Global Aggregate ex USD Bond Index; data through 4/16/24
Rethinking the outlook
Traders aren’t the only ones reconsidering the path forward for rates, analysts are as well. To wit, RBC Capital Markets made numerous changes to its rate projections over the course of April. Whereby the Fed was previously seen as the first mover, it may now be the laggard.
Federal Reserve (Current policy rate range: 5.25 percent to 5.50 percent)
- Previous RBC Capital Markets projection: Three rate cuts this year to a rate in the 4.50 percent to 4.75 percent range beginning in June and two more in 2025 in the 4.00 percent to 4.25 percent range.
- Updated projection: Just one rate cut this year to a rate in the 5.00 percent to 5.25 percent range in December and two more in 2025 to a rate in the 4.50 percent to 4.75 percent range.
- Why the change? Recent inflation data has been stronger than expected which likely won’t give the Fed the “greater confidence” that inflation remains on track toward two percent to begin rate cuts by June or July. But while RBC Capital Markets doesn’t expect a material reacceleration in inflation, it’s the presidential election this fall that could give the Fed pause and reason to avoid starting a rate cut process at its September or November meetings, effectively leaving December as the only option for a cut.
RBC’s call for only two rate cuts to follow in 2025 is, by our own admission, highly uncertain, but predicated on the idea that if the U.S. economy is still humming along by this December, as it has been thus far, then the case for multiple “insurance cuts” could be a tricky one to make.
European Central Bank (Current policy rate: 4.00 percent)
- Unchanged RBC Capital Markets projection: First cut in June, two more this year to 3.25 percent, and three more in 2025 to 2.50 percent
- Why is there no change? The ECB has given the clearest signals that it continues to move toward a rate cut in June. While inflation has stayed sticky in recent months, economic growth momentum has been slowing while moderating wage pressures should soon begin to drag inflation lower.
Bank of England (Current policy rate: 5.25 percent)
- Previous RBC Capital Markets projection: First cut in August, three more this year to 4.25 percent, and two more in 2025 to 3.75 percent
- Updated projection: First cut in August, but only one more this year to 4.75 percent, and two more in 2025 to 4.25 percent
- Why the change? While policymaker rhetoric continues to guide toward rate cuts, recent data has shown the economy is recovering both earlier and more strongly than expected by both the BoE and RBC Capital Markets, likely justifying a shallower path for rate cuts this year.
Bank of Canada (Current policy rate: 5.00 percent)
- Unchanged RBC Capital Markets projection: First cut in June, three more this year to 4.00 percent, and four more in 2025 to 3.00 percent
- Why is there no change? We think the BoC has the easiest rate-cut case to make amid a murky economic outlook and an ongoing deterioration in labor market conditions, where the unemployment rate is up 1.3 percentage points from the post-pandemic low.
That ’90s Show
One key factor behind RBC Capital Markets’ revised Fed outlook is simply the economic experience of the 1990s. That period has long been held up as the gold standard of Fed policy setting. After a flurry of rate hikes to rein in inflation in the early part of the decade, the Fed simply delivered a handful of insurance cuts in the middle part and the economy continued to run into the early 2000s, a run largely fueled by a tech boom, which should sound familiar.
RBC Capital Markets’ outlook reflects a similar 75 basis points of policy easing ahead. But whether it also gives way to a resumption of rate hikes in the years ahead remains to be seen. It would be an exceedingly rare example of the Fed actually engineering a soft economic landing—that is to say, raising rates aggressively without inducing a recession.
RBC’s revised Fed outlook reflects similarities to the 1990s economic cycle
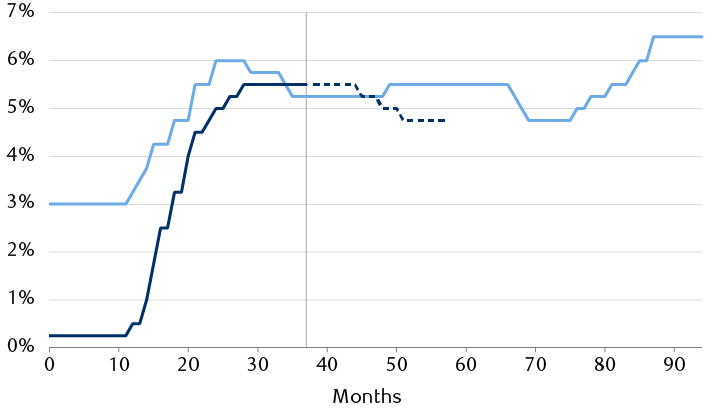
The line chart compares the path of U.S. interest rates from 1992 to 2001 to the current interest rate cycle, which began in 2022. In 1994 the Fed raised rates quickly from 3% to 6%, while in 2022 and 2023 the Fed raised from 0.25% to 5.25%.
Note: Chart starts 12 months before the first increase of each interest rate cycle.
Source - RBC Wealth Management, Bloomberg; data through 4/16/24
What, why, and how?
So, that’s the what and the why of a revised central bank outlook, but how should investors proceed? Another round of rising yields has investors and traders wondering again where the selling stops, and when they should step in and buy. In our view, we are nearing that point. Markets, as they can be prone to do, may have potentially moved from one extreme to another, or from far too many rate cuts priced in at the start of the year, to too few now.
We still see the bar to resume raising rates as being extraordinarily high for the Fed, and certainly for most central banks, and, therefore, the Fed’s rate guidance from the March meeting should still serve as a reasonable guidepost for how high yields can rise. The chart below shows the benchmark 10-year Treasury yield relative to where the Fed has projected the peak policy rate over upcoming years, as indicated by its Summary of Economic Projections. After another sharp rise in yields to start 2024, how much higher could they go?
Hitting the ceiling?
Ten-year U.S. Treasury yield likely to hold below the Fed’s rate guidance
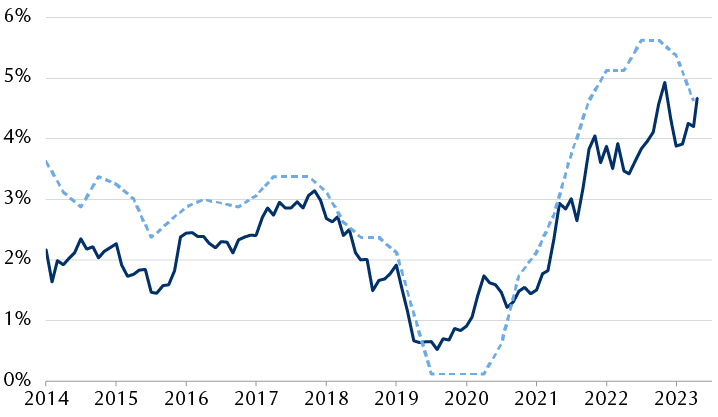
The line chart shows the benchmark 10-year U.S. Treasury yield relative to the Federal Reserve's outlook for short-term policy rates. For much of the past decade, the 10-year yield has held below the Fed's peak projections.
Note: Shows maximum level of the Fed’s one-to-three-year interest rate projections.
Source - RBC Wealth Management, Bloomberg, U.S. Federal Reserve; data through 4/16/24
At the Fed’s March meeting, the median forecast of policymakers showed three cuts in the fed funds rate to 4.63 percent this year, roughly where the 10-year Treasury yield currently trades. But if RBC Capital Markets is right and the Fed only cuts once to a mid-point of 5.13 percent, the 10-year Treasury yield could potentially trade higher and toward that level. That range—approximately 4.6 percent to 5.1 percent—forms our near-term target level for the 10-year before it begins to fade to 4.30 percent by year-end, as RBC Capital Markets currently projects. That framework for thinking about yields relative to central bank policy rate expectations should hold broadly true on a global basis as well.
For U.S. investors, we now recommend gradually moving out of cash and/or short-dated bonds and into longer-dated bonds over the course of 2024, but perhaps at a more expeditious pace for global investors with other central banks set to cut earlier.